DATA2GO.NYC Technical Assistance and End of Summer Update
Here’s what we’ve been up to over the summer.
Data Clinics and Data2Go Demos
In April, we launched the updated version of DATA2GO.NYC, our free online mapping and data tool. DATA2GO.NYC lets users explore over 400 indicators of well-being and access to opportunity across New York City’s nearly 200 neighborhoods.
Measure of America is now hosting a second round of our Technical Assistance Data Clinic for NYC nonprofits. This free, interactive program is designed to empower New York City nonprofit leaders to use data to better target their services, increase their impact, and communicate their results. Participants will get to create their own projects using data that is relevant to their needs. The program will consist of four workshops from October 29th to November 19th. Applications are now open and will close on October 20th—sign up for free now!
Measure of America is also offering free, open-to-the-public demos of DATA2GO.NYC to show interested users the tool’s new indicators, geographies, and other features. You can sign up now for a demo on either October 9th, 12-1pm or October 15th, 1-2pm. Please feel free to share the Data Clinic application and the demo sessions with your networks.
The Empire Bins Strike Back
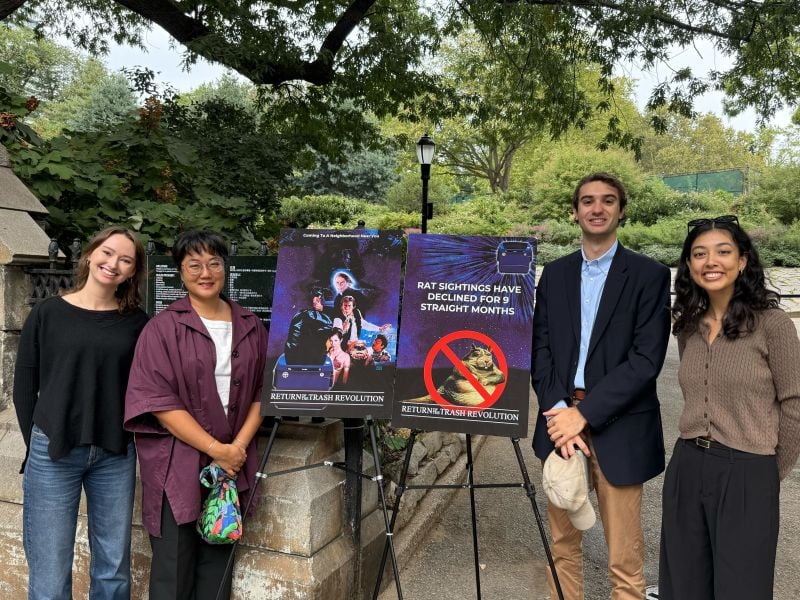
On September 16, Brooklyn Community Board 2 was announced as the second district to have trash be fully containerized. CB2 participated in the first round of our Technical Assistance Program over the summer, and we’re thrilled to see the impact of the data visualization they worked on during our program.
Watch the Press Conference Here
 |
 |
Youth Disconnection Trends
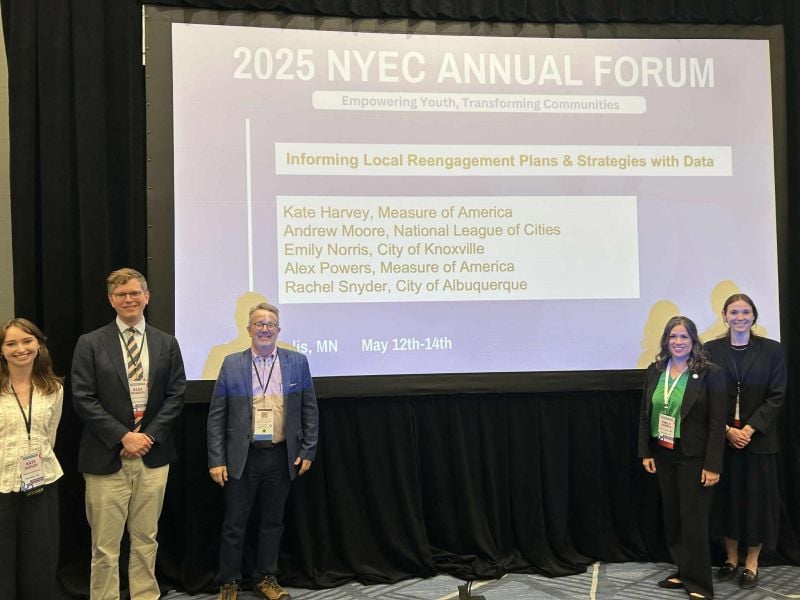
In May, the Measure of America team presented at the National Youth Employment Coalition Annual Forum. In the morning, Director Kristen Lewis and Associate Director Alex Powers presented on the latest national trends in youth disconnection. In the afternoon, Research Analyst Kate Harvey co-presented with Andrew Moore of National League of Cities, Emily Norris, Rachel Snyder, and Alex Powers about how data and mapping can inform local reengagement strategies.
Los Angeles Data Walks
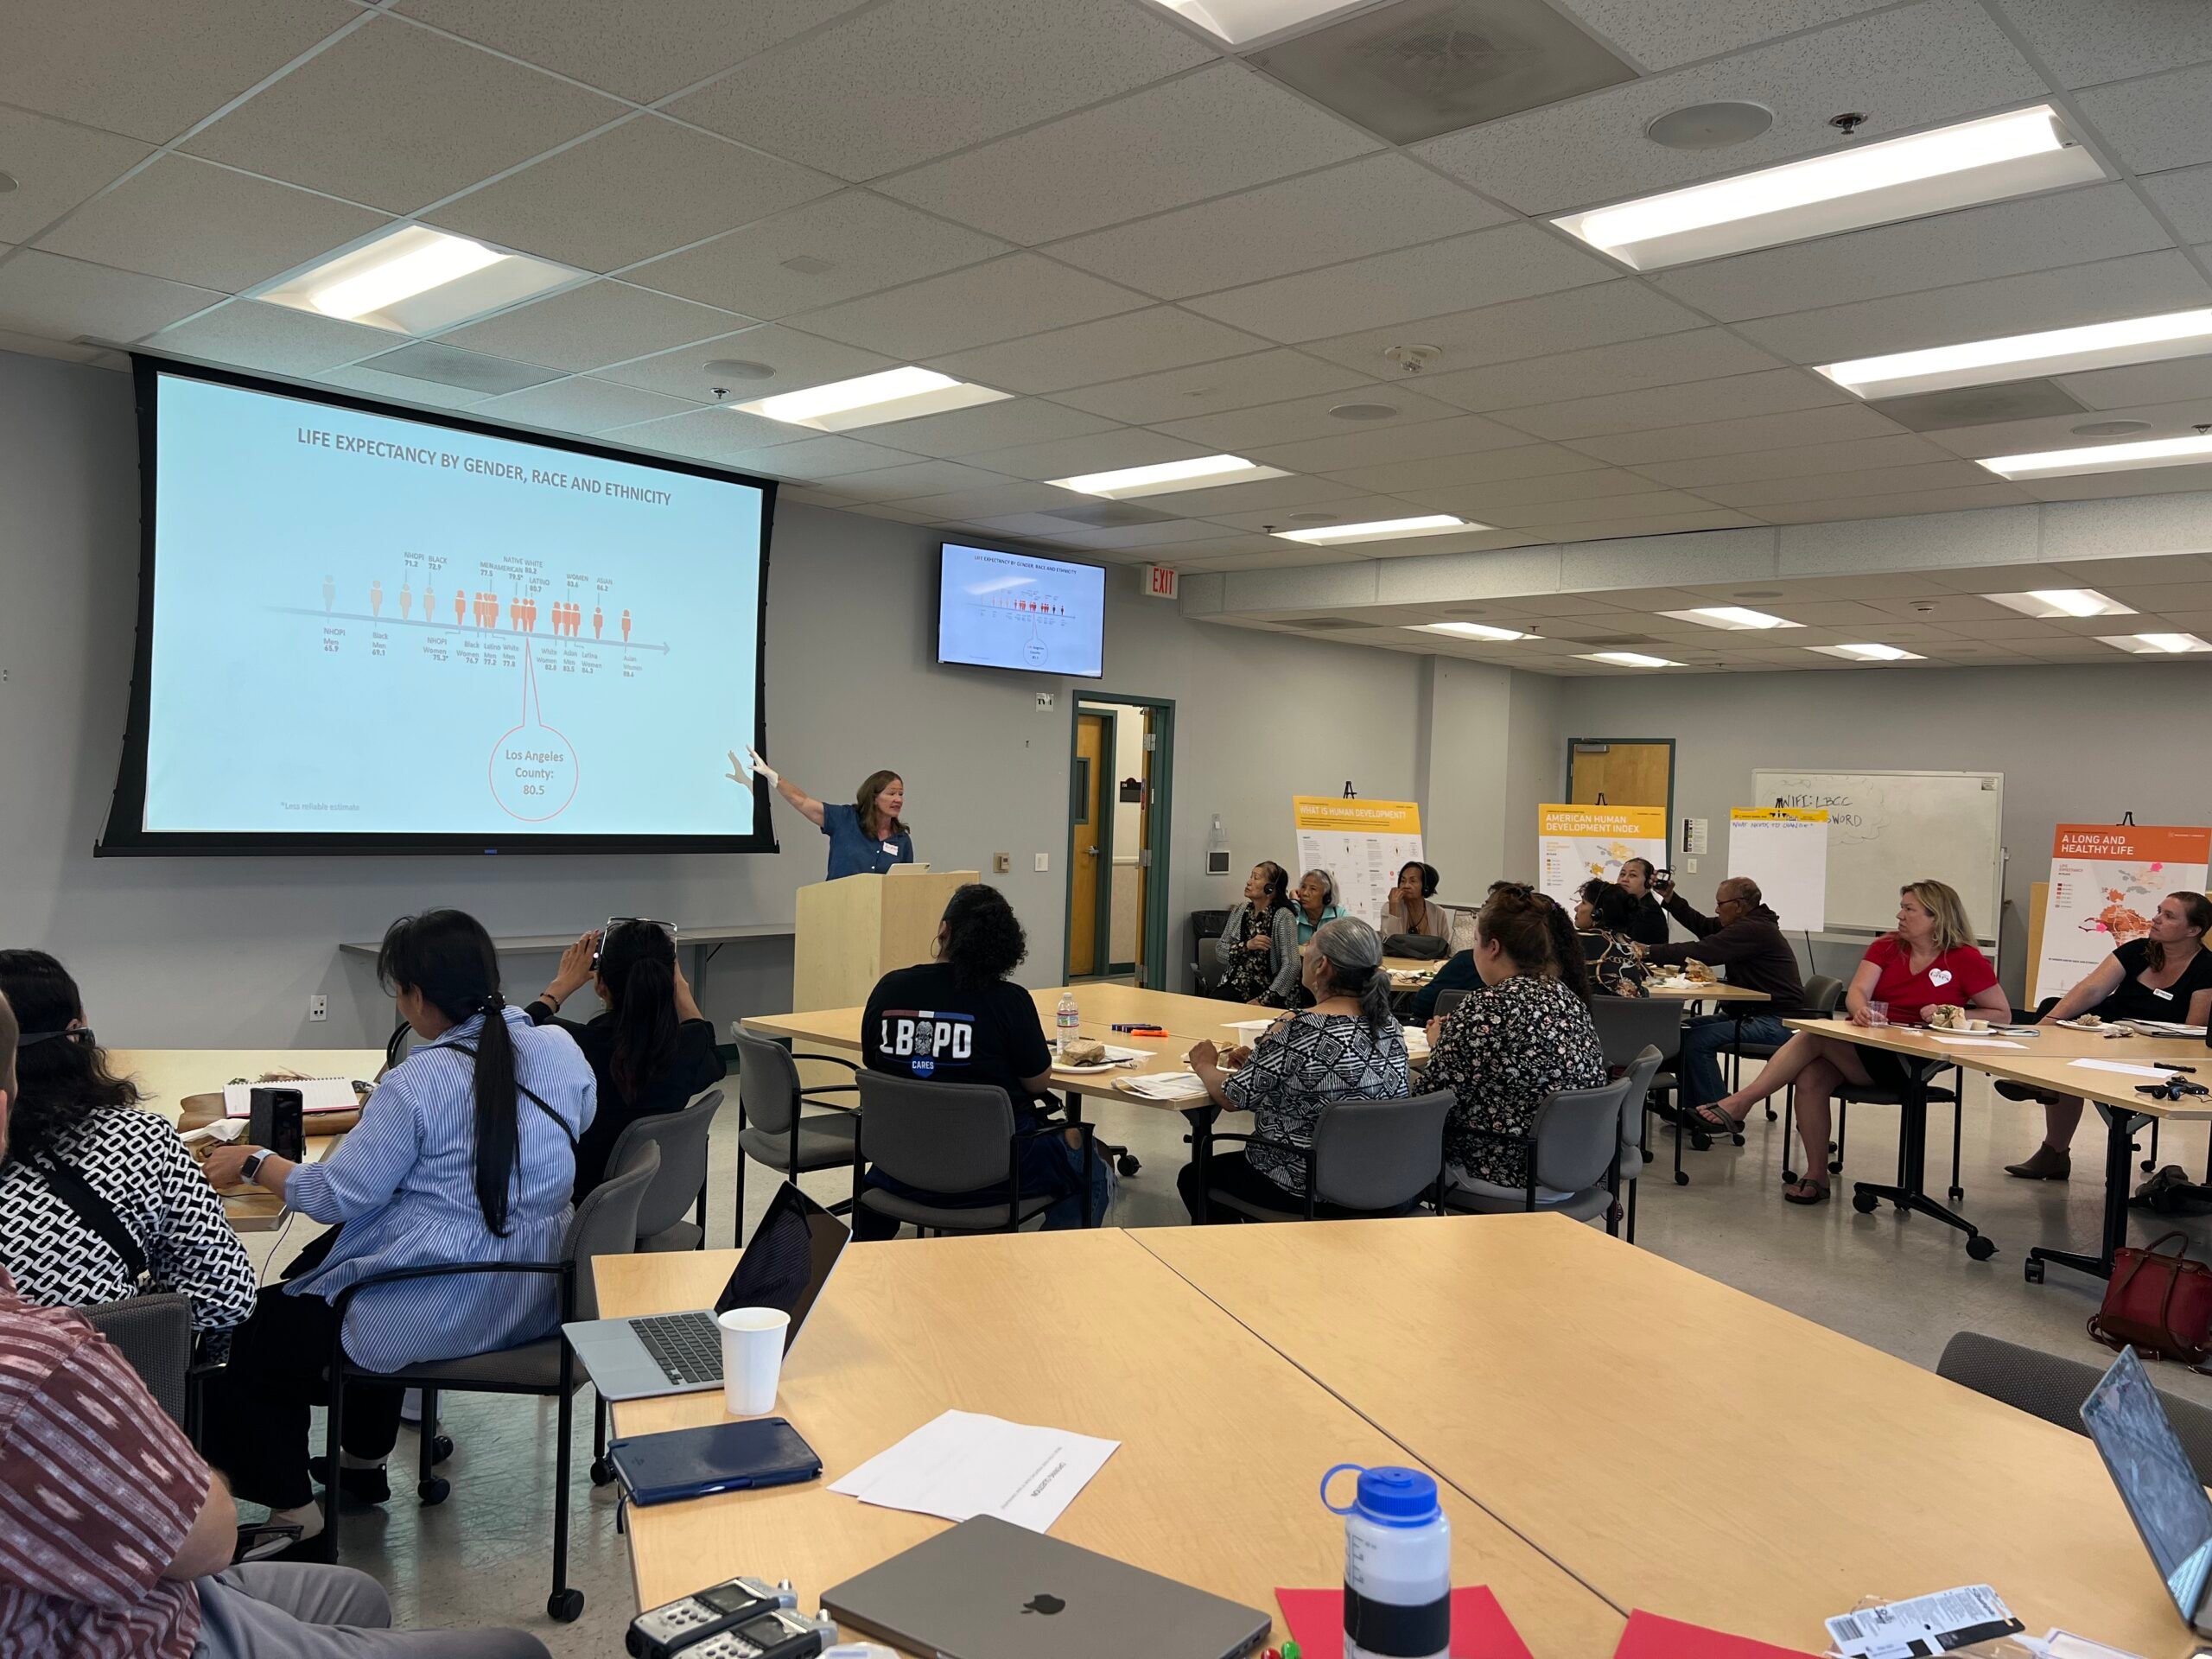
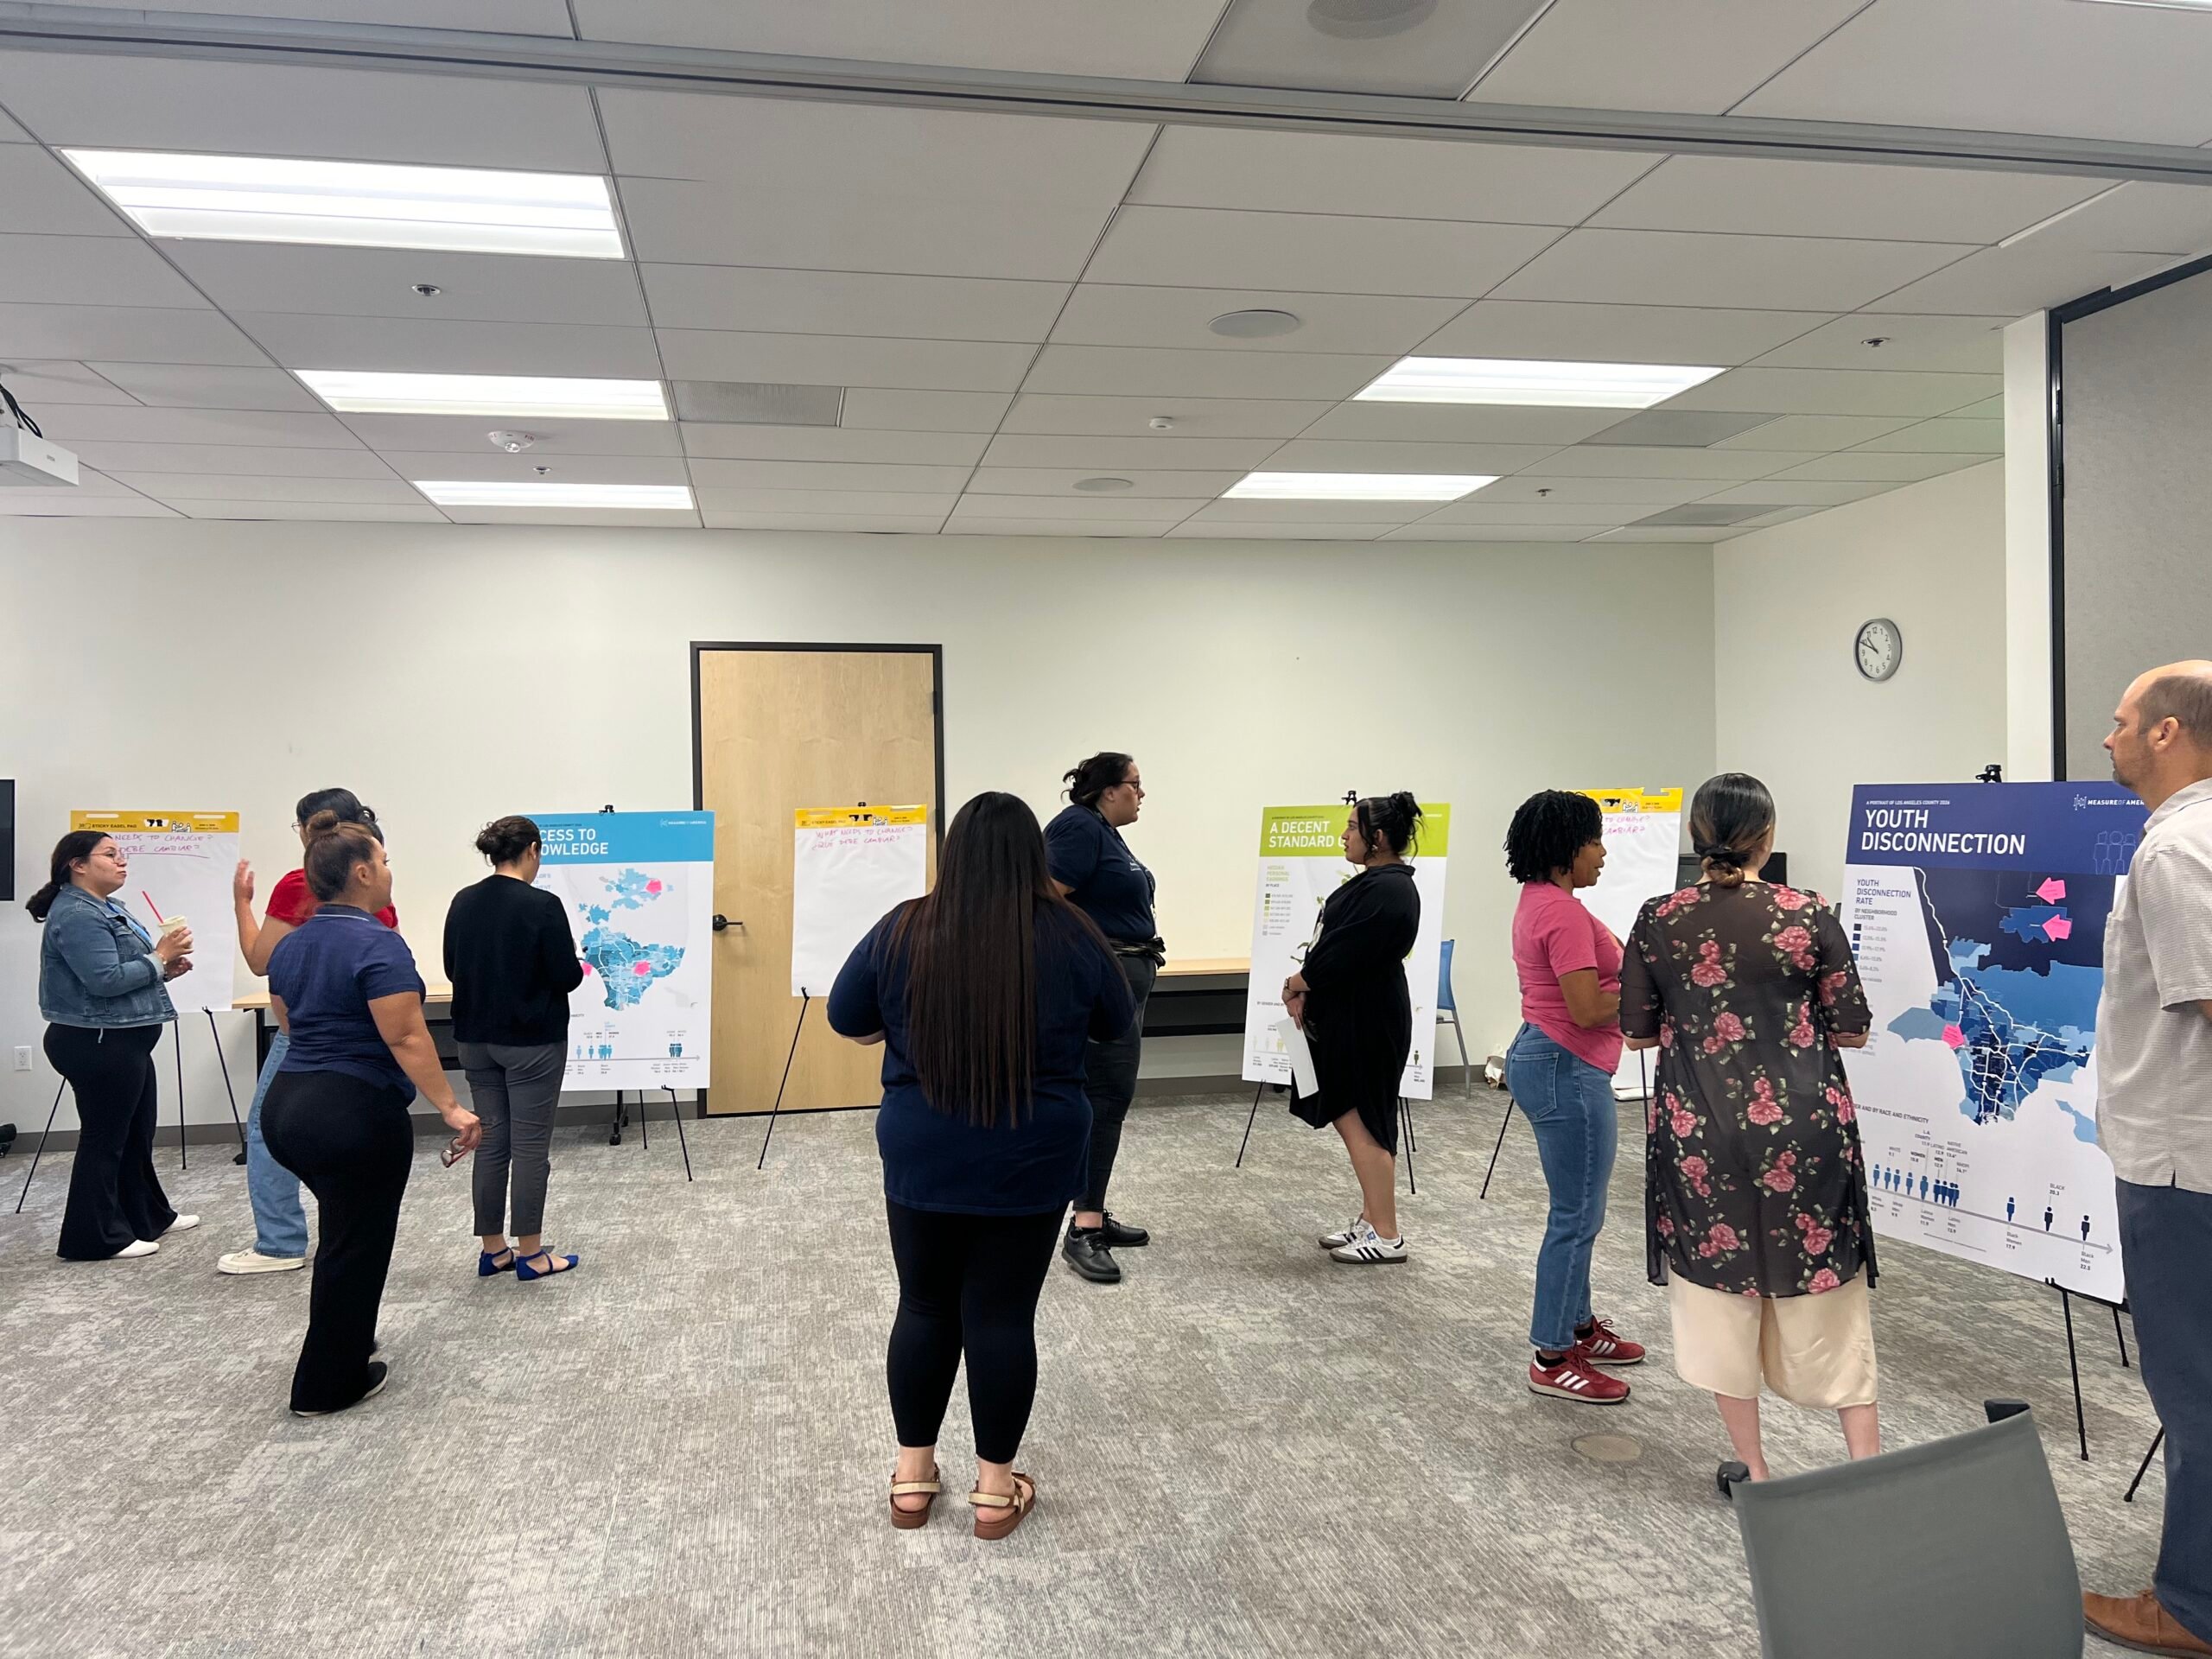
This summer we conducted in-person and virtual Data Walks with communities across Los Angeles County in support of our upcoming “A Portrait of LA County 2026.” We are so grateful for our partnership with First 5 LA—they helped support this work and connect us with their Best Start communities. We’re also thankful for The Nonprofit Partnership in Long Beach and All For Kids in the Antelope Valley for helping us host our in-person engagements, as well as El Nido Family Centers, Rising Communities, InnerCity Struggle, Los Angeles Opportunity Youth Collaborative, and Los Angeles LGBT Center for hosting virtual events for residents of the San Fernando Valley, South LA, and East LA, as well as youth leaders and LGBT Angelenos.
These data walks gave us invaluable insight from community members, and we look forward to launching the full report early next year—stay tuned!
 |
 |
Adapting to the Future of Work
On July 31, Measure of America presented at JobsFirstNYC’s Adapting to the Future of Work convening. Research Analysts Tara Shawa and Kate Harvey presented about how DATA2GO.NYC can be used to inform workforce development strategies.
MOA in the News
Lower Manhattan’s local newspaper, The Broadsheet, started a new series sharing insights about life in Lower Manhattan using data from DATA2GO.NYC. Their first article featured Measure of America data on human development and other core statistics.
Measure of America research on youth disconnection was comprehensively used to support a Christian Science Monitor article highlighting Las Vegas programs working to reduce the city’s 14.8% disconnection rate.
Newark Report Launch and more Data-to-Action
We are happy to share a few updates about what we’ve been working on since the beginning of the year.
A Portrait of Newark Launch

A Portrait of Newark is an exploration of how Newark residents are faring. It examines well-being and access to opportunity using the human development framework and index, presenting American Human Development Index scores for Newark census tracts, wards, and demographic groups, and examining a range of critical issues, including health, education, living standards, and youth disconnection.
Supporting Disconnected Youth in Congress
Rep. Michelle Steel (R-CA) and Rep. Troy Carter (D-LA) are joining together to create a new Bipartisan Opportunity Youth Caucus (BOYC). This is the first congressional caucus focused on elevating the importance of investing in opportunity youth and providing education and information to members of Congress. Measure of America director, Kristen Lewis, spoke at the caucus’s launch event.
Watch the Event Recording Here
In additional congressional activity, Senators Tim Kaine (D-VA) and Laphonza Butler (D-CA) introduced the Opening Doors for Youth Act in the Senate, which would provide substantial funding to local communities to support disconnected youth.
Learn about the Opening Doors for Youth Act
Data2Go Revamp and Open Data Week

In March, Measure of America participated in New York City’s Open Data Week. We presented our DATAGO.NYC tool and gathered feedback for our upcoming revamp.
We are currently in the process of updating our Data2Go tool. Set to launch this summer, the revamp will feature an updated look and feel to the site along with new dashboards and functionality. We will also be updating the current indicators and integrating many new ones. Stay tuned for news on the revamp launch!
Data to Action in 2024
Measure of America research continues to make an impact.
In January, New Jersey Governor Phil Murphy signed a new Youth Disconnection Prevention Bill that establishes an ombudsperson to ensure that schools are supporting students and reengaging those who are disconnected. This bill was championed by one of partners, Newark Opportunity Youth Network, and cited research from our report, A Disrupted Year.
Youth Disconnection Prevention Bill in NJ
In February, more legislation was passed in New Jersey. The state’s new YouthBuild Act establishes a grant program to support organizations serving opportunity youth. Our work was referenced to highlight the need for this programming.
2023 Data-to-Action Roundup
As we approach the end of the year, Measure of America wanted to share a few key stories of how our work has made an impact throughout 2023.
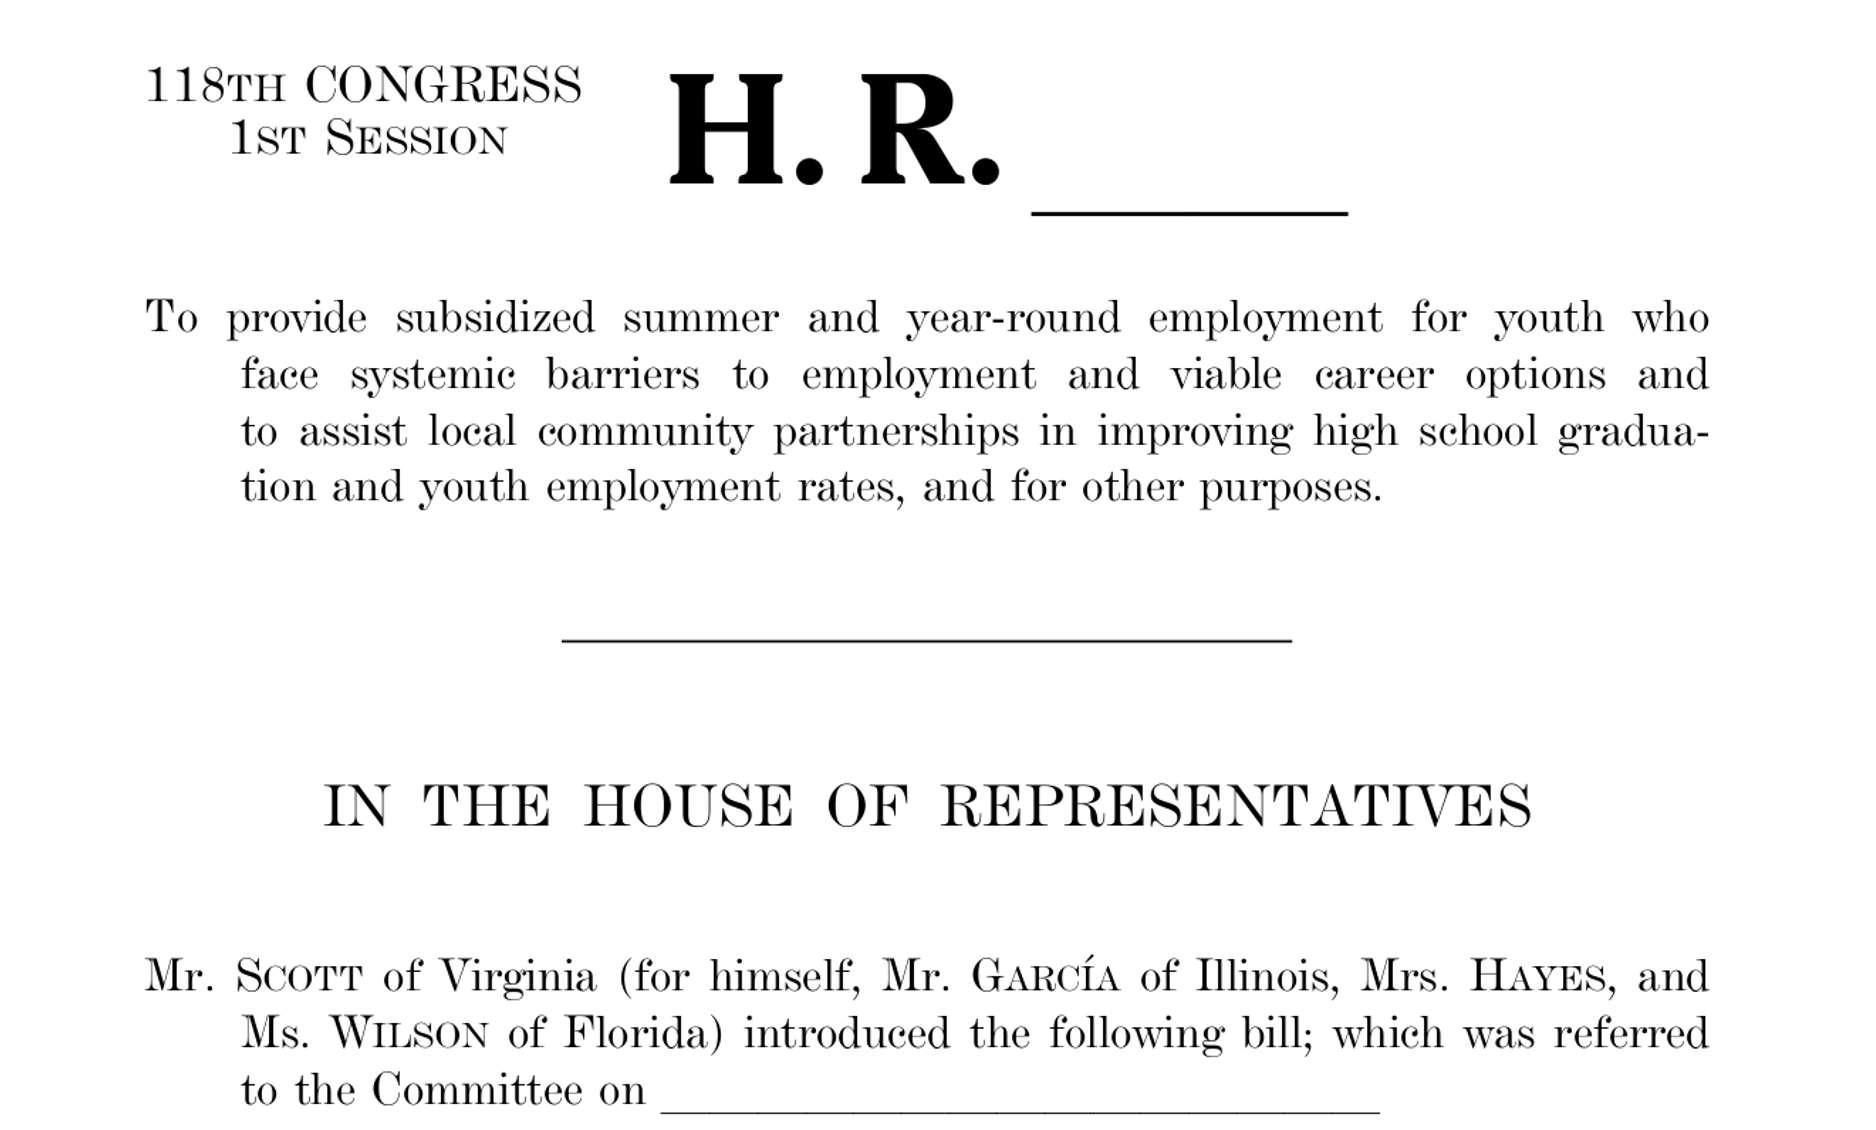
Measure of America Research Used in Congressional Bill
On September 15, Rep. Robert C. “Bobby” Scott, with the House Committee on Education and the Workforce, reintroduced the Opening Doors for Youth Act of 2023—legislation to invest $6.75 billion to address the challenges facing young adults who become disconnected from both school and work.
The authors of this bill used multiple Measure of America reports to frame the issue and argue for its importance.
Read the House Committee Press Release here.
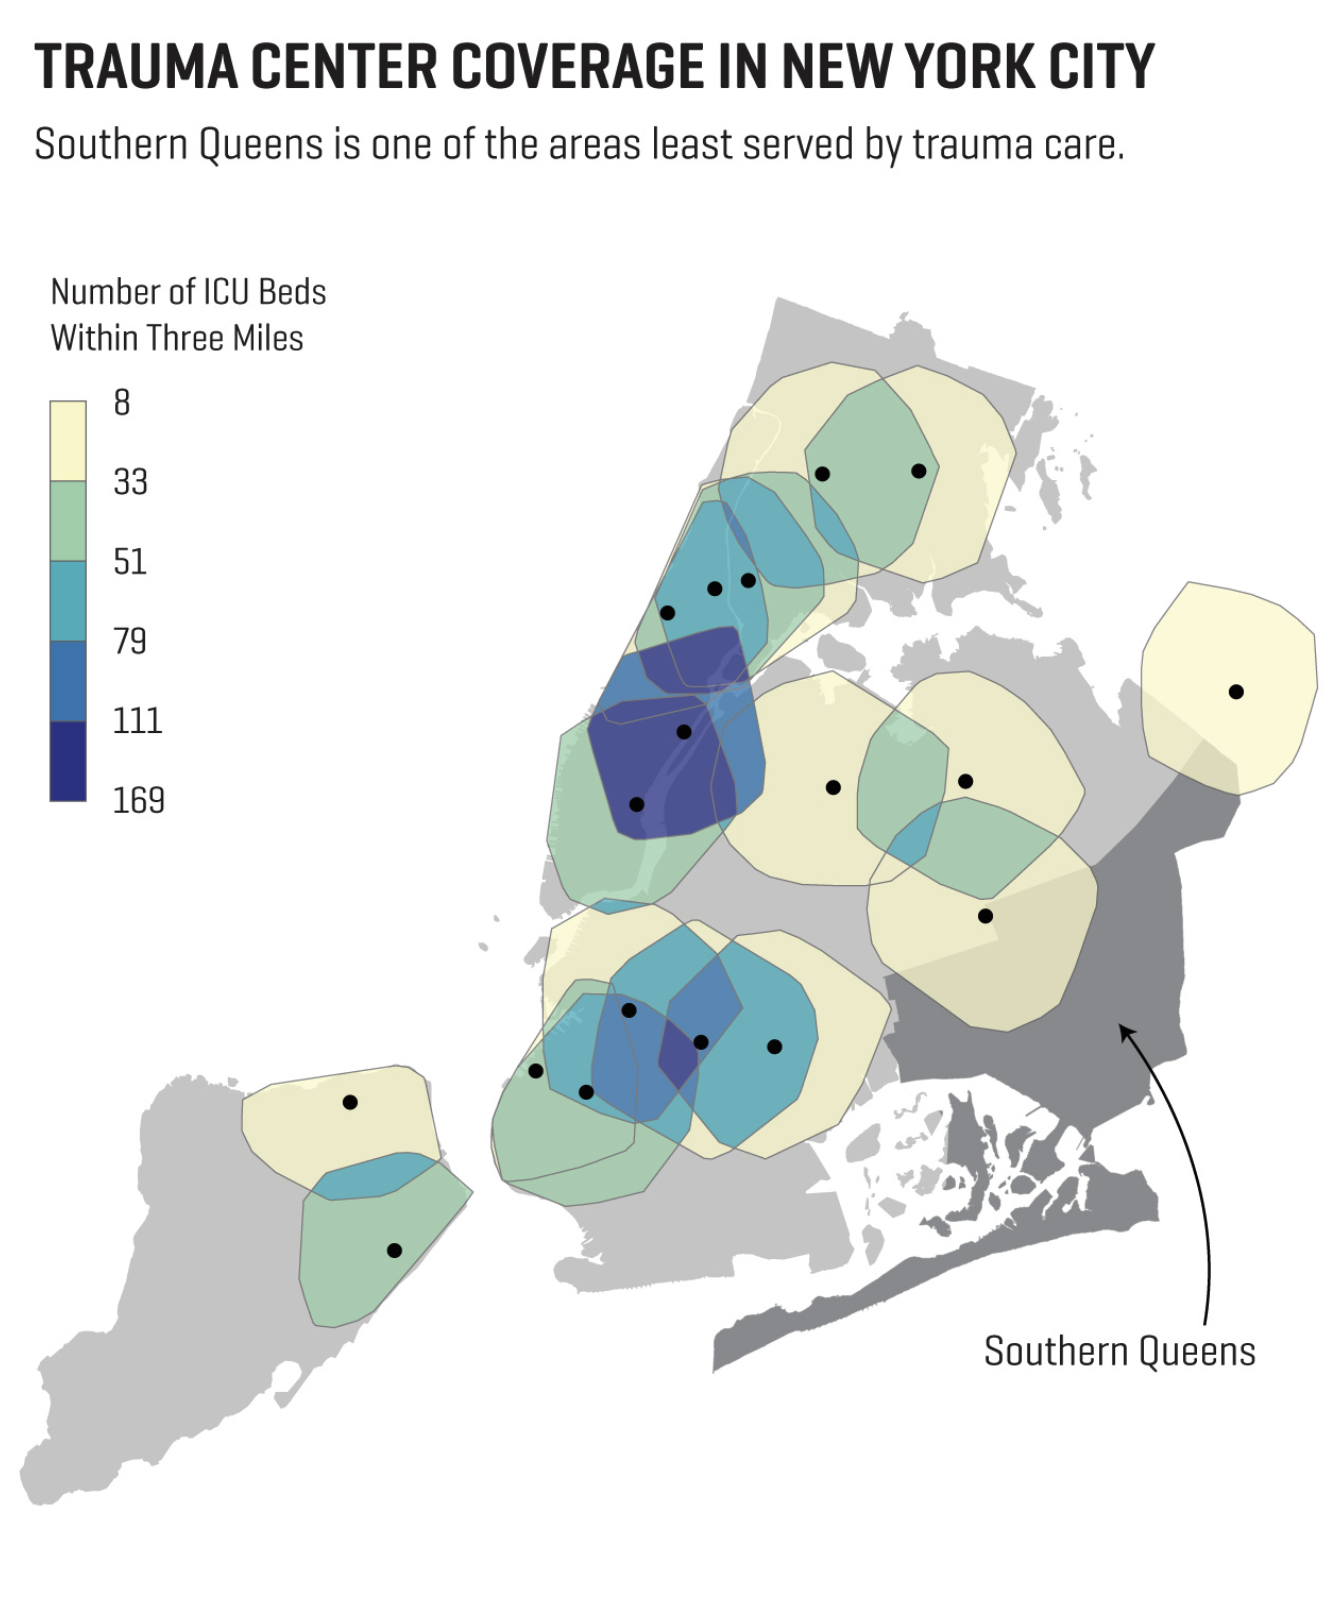
Jamaica Hospital to Expand Trauma Bays
In April, a New York state board gave the go-ahead to commit $150 million in state funding to expand trauma care capacity at Jamaica Hospital.
In 2019, as part of DATA2GO.NYC, Measure of America worked with journalists to identify where in New York City shooting victims were most likely to die; it was Southern Queens.
In the run up to the 2020 Democratic primary for Queens Borough President, all of the candidates pledged to improve access to trauma centers in response to this analysis and reporting.
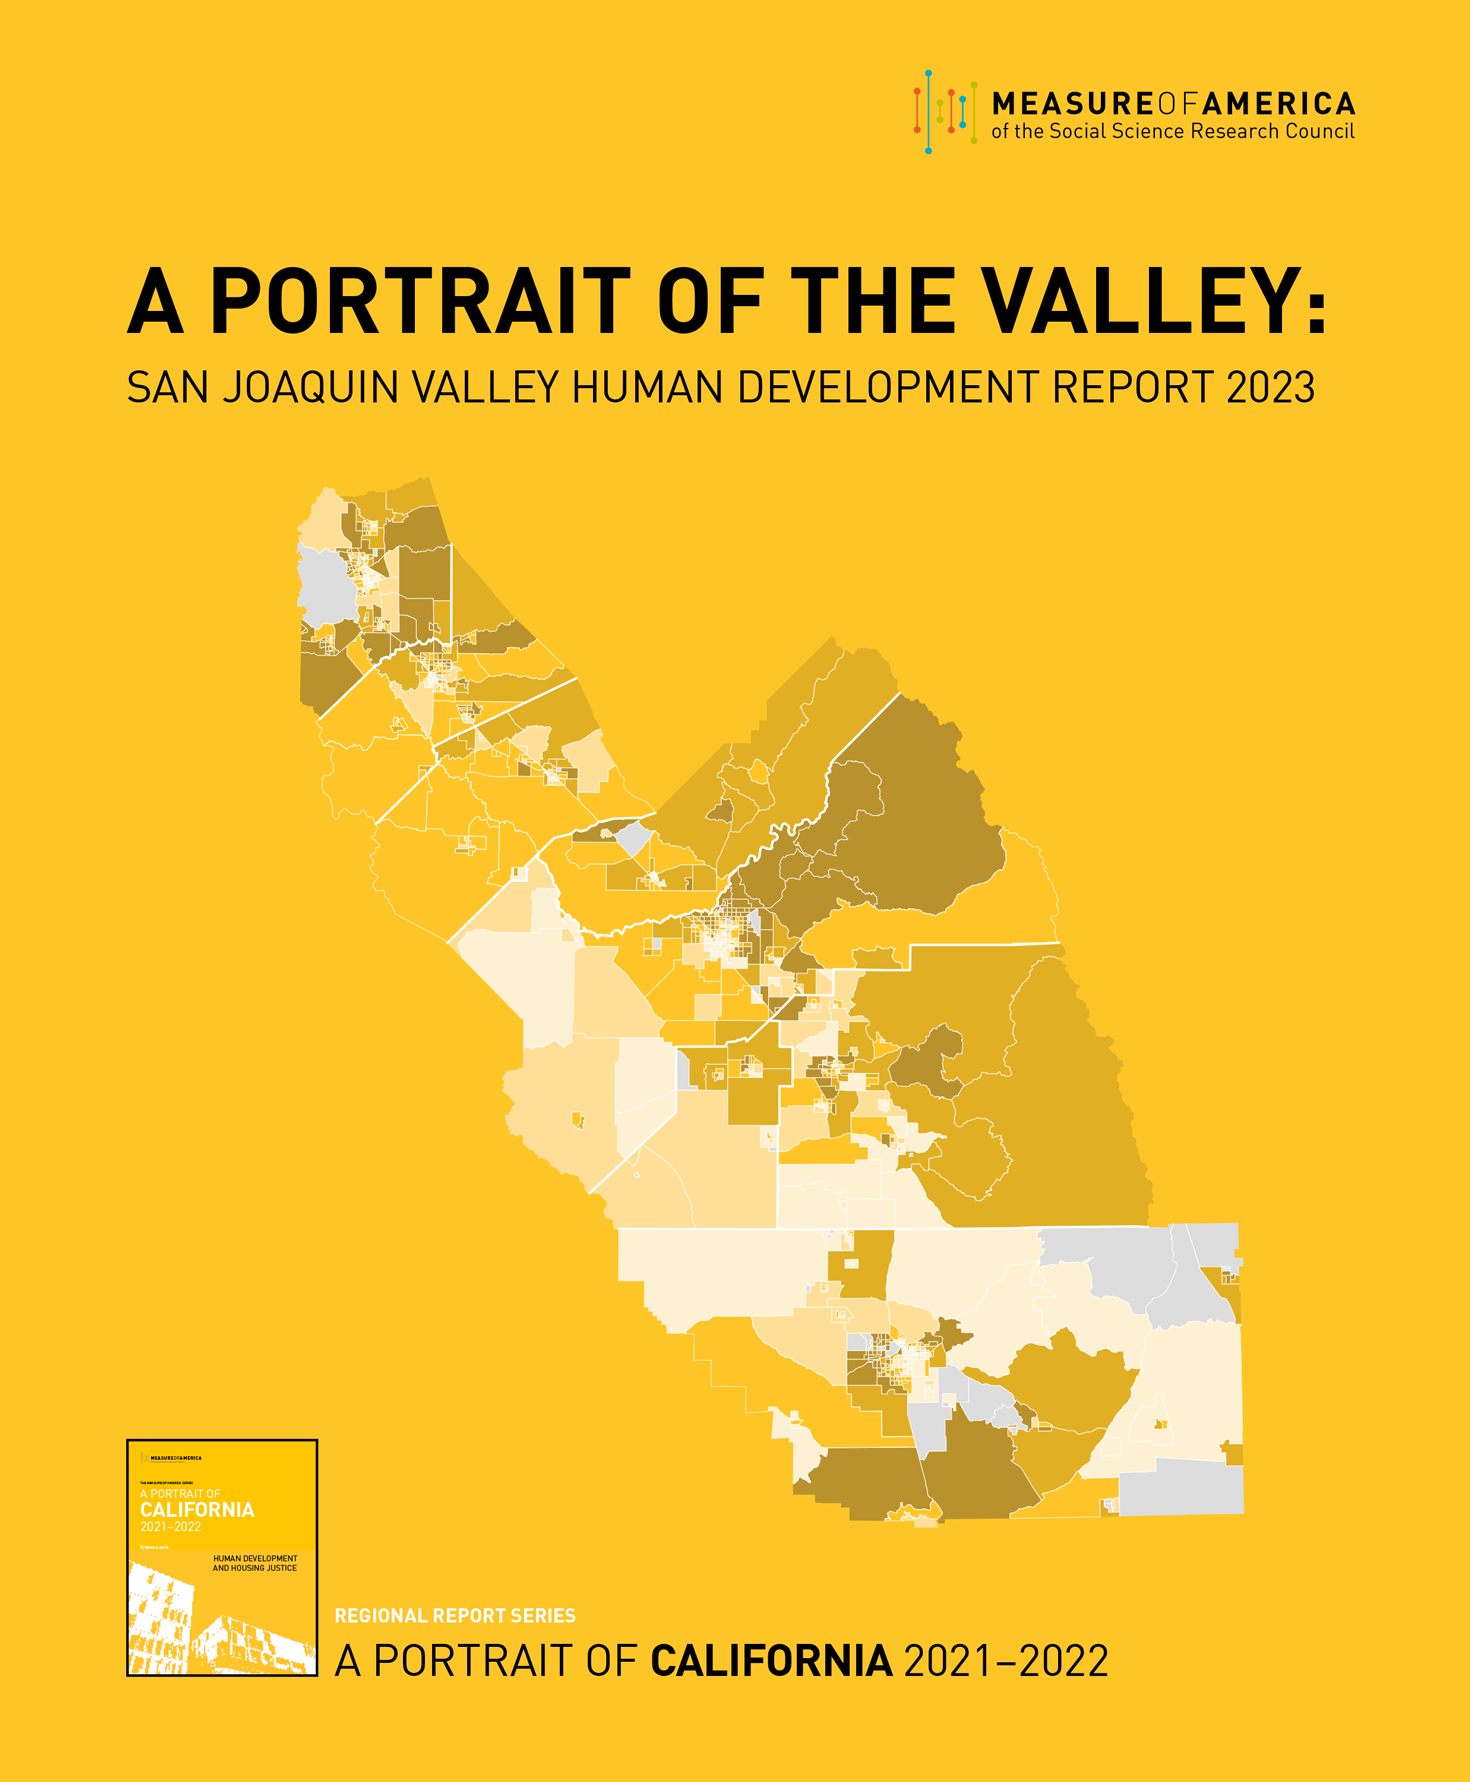
Well-Being in the San Joaquin Valley
In March, we launched our report A Portrait of the Valley, an extensive study on well-being in California’s San Joaquin Valley.
The report detailed several policies that can improve well-being for all while reducing disparities in health, education, and income. It has served as a resource for communities, advocates, and policymakers working toward closing gaps in well-being.
At our launch event, we learned that our first report in 2008 inspired a local pediatrician to focus her career on public health and start a rural health equity collaborative, and that for a former US Representative, our data on the San Joaquin Valley was an important part of framing his Congressional campaign.
Youth Disconnection in Central Louisiana
This September, Measure of America released a report about youth disconnection in Central Louisiana.
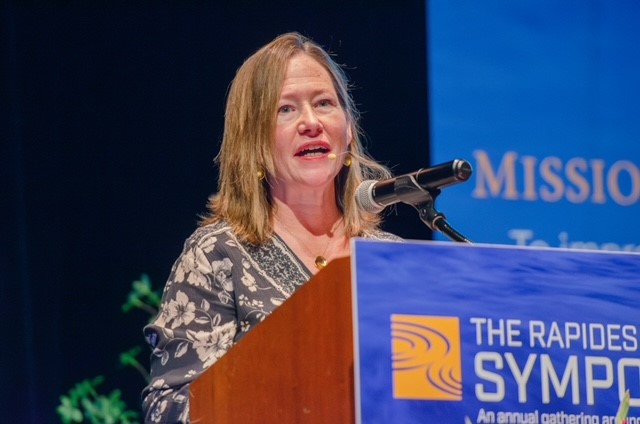
Following the launch of the report, Measure of America Director Kristen Lewis was the keynote speaker at The Rapides Foundation’s symposium on opportunity youth. This is the second time Measure of America has worked with The Rapides Foundation to surface and bring meaning to data about youth disconnection in their service area.
Tailoring Reengagement Strategies For America’s ‘Opportunity Youth’
This blog post originally appeared in the National League of Cities’ CitiesSpeak blog on June 14, 2018. You can access the original article here.
By: Kristen Lewis, Sarah Burd-Sharps and Marina Recio
As American as apple pie, “freedom” and “opportunity” are the ideals our country is supposed to represent — and that every city leader strives toward. But for too many young people today, opportunity is a promise unfulfilled, and their freedom to choose what to do, who to be, and how to live is only nominal.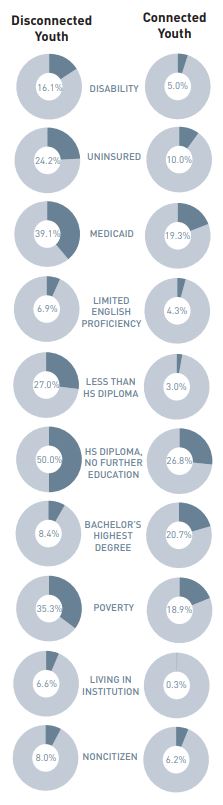
Two words have recently entered the policy vocabulary: disconnected youth. Often referred to as “opportunity youth,” teenagers and young adults ages 16 to 24 who are not in school or working are considered disconnected. Being unmoored from the worlds of school and work during the transition to adulthood is, needless to say, incredibly disruptive, and the repercussions are long-lasting.
Increasingly, policymakers, advocates and other city leaders are using data to identify cities and neighborhoods where young people are disconnected at the highest rates. In the 100 largest metro areas, those disconnected represent between 6 percent of young people (Des Moines, Iowa) to 20 percent (Bakersfield, California).
Within cities, the contrasts between the most and least advantaged neighborhoods are even starker. And data can tell us much more.
All opportunity youth have one thing in common: they need pathways to reconnect to school and work as well as tangible support. The goals are clear: high school diplomas or GEDs, college degrees or career and technical training, and decent employment. But to help young people get — and stay — on a better path, we need to know what barriers are standing in their way and what kinds of support they need.
Measure of America’s latest report, More Than a Million Reasons for Hope: Youth Disconnection in America Today, finds important differences in economic and educational backgrounds, living situations, disability rates, and marriage rates between young people who are disconnected and those who are not, all of which point to a difficult reality: Disconnection is often years in the making, and offering jobs to young people is often not enough.
The report also finds that not all disconnected young people face the same challenges. Young women who are disconnected have particularly high poverty rates and unique challenges like early marriage and motherhood that merit attention and resources.
A disproportionate twenty percent of black young men who are disconnected live in institutional quarters, which include prisons, detention centers, residential treatment centers, psychiatric hospitals and other similar institutional settings, compared to just 0.3 percent of the overall population their age. 33 percent of Latino young men who are disconnected dropped out of high school—the highest rate of any group. For Asian young people, English proficiency and citizenship are the most notable factors contributing to disconnection.
Moreover, growing up in poverty, especially in highly disadvantaged neighborhoods, often isolates young people from the educational options, social networks, job opportunities, and reliable transportation that help connected young people build independent adult lives.
Strategies need to be nuanced and holistic in order to be effective. Take Chicago and Houston for instance; both have opportunity youth populations that exceed 100,000 people. However, these disconnected populations are demographically very different. In Houston, the largest group of opportunity youth is Latina women, who make up close to one in three young people who are neither working nor in school; in Chicago, it is black young men, who make up one in five opportunity youth, who face the greatest challenges.
The main challenges for these groups are very different, so reducing the rate of youth disconnection in these two cities will require different — tailored — approaches. The greatest challenges facing disconnected Latinas are young motherhood, high school completion and language proficiency; about 30 percent dropped out of high school, almost a third are mothers, and more than a fifth speak English “less than very well.” Young disconnected Latinas would benefit most from programs to connect them to education that include wraparound services, including childcare and language classes.
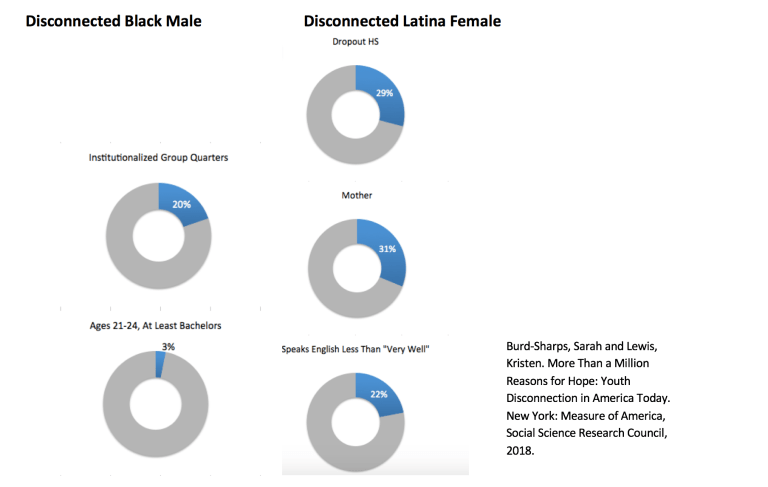 For young black men who are disconnected the most pressing challenges are contact with the justice system and college education; as mentioned earlier, an astounding one in five disconnected young black men are institutionalized, and only three percent of those ages 21 to 24 have a college degree, the lowest rate of any race and gender group. Youth incarceration is one of the most troublesome causes of disconnection, not least of all because policies and institutions have contributed to its unacceptable scale and racial disparities.
Locking up young people is not only incredibly expensive — research also shows that it is an ineffective strategy for reforming behavior or reducing crime. A criminal record makes any attempt at re-connection even more difficult, undermining a young person’s chances to lead a productive life. Focusing on criminal justice reform, in addition to college-readiness and post-incarceration reintegration programs, could help reduce rates and racial gaps in youth disconnection in Chicago.
The good news is that there are local initiatives in both cities working on these issues—like the Juvenile Justice Initiative and Thrive Chicago addressing youth incarceration and youth disconnection in Chicago, and Hire Houston Youth connecting young Houstonians to employers. But we can do much more.
With the growing momentum, there is no better time to build on existing efforts than now. City leaders must not only invest in programs that connect young people to school and work resources, but also do so in ways that recognize the complexity of the issue. Making the most of every dollar invested will take a tailored, evidence-based approach and a willingness to learn more about the root causes and dynamics of disconnection in their cities. A good start is to include both data analysis and the voices of young people who have experienced disconnection as part of the reengagement planning process.
This is a unique opportunity to interrupt the cycle of disadvantage in marginalized communities. It is up to city leaders to take it.
Youth Disconnection Rates Highlight Structural Barriers to Achievement in the US
This blog post originally appeared in SSRC’s Items on April 3, 2018. You can access the original article here.
By: Kristen Lewis, Sarah Burd-Sharps and Becky Ofrane
Youth disconnection—the rate of young people ages 16–24 who are not in school or working—is a strong indicator of a community’s collective capabilities and a telling gauge of its residents’ access to opportunity. The consequences of youth disconnection reverberate through communities and society as a whole: a labor force with too few skilled workers to fill entry-level jobs, which require greater skill than entry-level jobs a generation ago, much less to compete in today’s global economy; greater need for public assistance of all sorts; higher rates of crime and incarceration, which have high personal and societal costs; poor physical and mental health, costly in both human and financial terms; and a heightened risk of poor outcomes for the next generation.
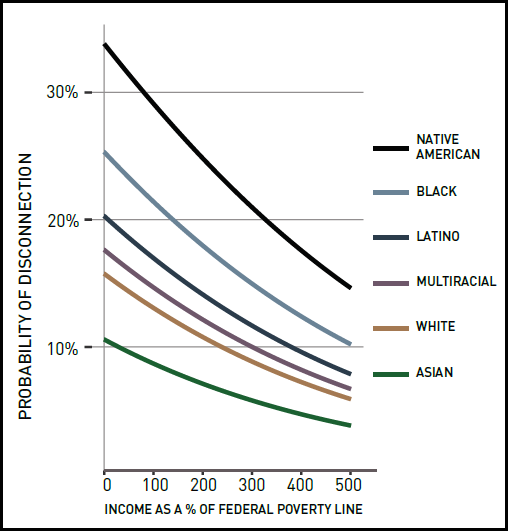
Measure of America’s newest report on youth disconnection in America, More than a Million Reasons for Hope,11 shows that in 2016, a total of 11.7 percent of young Americans were disconnected, an improvement from the 2015 rate of 12.3 percent, and a 20 percent decrease from the 2010 peak rate of 14.7 percent, in the aftermath of the Great Recession. Yet 4.6 million young people remain out of work and out of school. This overall improvement is cause for celebration, and underscores the importance of a thriving economy, but a deeper look at the data by race and ethnicity shows concerning trends—particularly the gap between Asians and whites on one hand and Latinos, blacks, and Native Americans on the other—pointing to structural problems in society that economic growth alone cannot solve.
Understanding the dynamics of this population matters. Emerging adulthood—that intense, exciting, and sometimes overwhelming period when our adult selves start to take shape—is a pivotal time in life. For connected young people, it is a time marked by positive firsts: the giddy thrill of hopping behind the wheel of the family car for that first solo spin, the pride of high school graduation, the sense of agency that comes with a first paycheck. Disconnected young people are robbed of these critical and affirming experiences. The limited education, social exclusion, lack of work experience, and minimal professional networks that are part and parcel of disconnection have long-term consequences that snowball through the years, affecting a range of well-being outcomes, from earnings and self-sufficiency to physical and mental health to relationship quality and family formation.

Is economic growth enough?
If disconnection rates are on a steady decline as the economy has expanded since 2010, isn’t that enough to suggest the trend will continue, and demonstrate that more and more young people are on their way to achievement? As we’ll explore further, there are a number of reasons to believe that depending on economic growth alone will not fully address the remaining gaps between racial and ethnic groups. Deep structural barriers to equitable advancement have existed for generations—particularly for blacks and Native Americans in the US—including the historical and continued discriminatory policies and practices present in the health and criminal justice systems as well as in the labor and housing markets. This structural racism pervades institutions and policies that in turn reinforce discriminatory beliefs and the distribution of resources. Acknowledging the ways in which the de jure racism of the past continues to cast its shadow into the present and developing programs that address racism explicitly will be needed to improve outcomes for young people of color. We are doubtful that economic growth alone will overcome these structural barriers for three reasons.
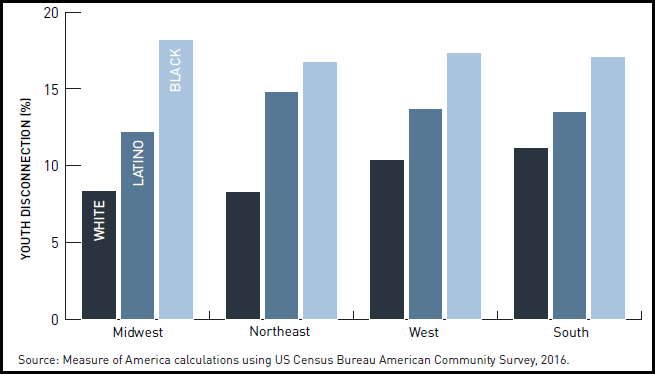
First, we’ve been studying youth disconnection since 2012 and the racial gap has been apparent nationally for all years of data we’ve analyzed, as well as in nearly every region, state, metro area, and county for which we have sufficient data to calculate it by race and ethnicity. Dividing the country regionally, blacks are faring best in the Northeast, with a 16.8 percent youth disconnection rate, which is still significantly higher than the region where whites are most disconnected (the South, at 11.2 percent). There are glimmers of hope where gaps have narrowed for some—for instance, Latinos have made the most progress in closing the gaps (from 18.5 percent in 2010 to 13.7 percent now)—but the disparities remain obvious and damaging.
Second, black, Latino, and Native American young people are particularly disadvantaged in ways that exacerbate their potential for disconnection.
• Poverty. Youth disconnection is strongly associated with poverty. Young people growing up in poverty face a range of challenges, such as residential segregation, poor-quality schools, inadequate transportation, worse health outcomes, greater exposure to neighborhood crime and violence, and more adverse childhood events. These challenges make it more difficult to thrive in school and create barriers to employment (for example, criminal histories, lack of academic accreditation). For certain groups, such as disconnected young women who are black as well as disconnected young women who trace their heritage to the Spanish-speaking Caribbean, the poverty rate approaches 50 percent.
• Incarceration. Incarceration has a known disproportionate impact on black communities and families. Compared to 4.5 percent of disconnected white young people, 12 percent of disconnected black youth live in institutionalized group quarters. Breaking it down further, nearly a fifth of disconnected black boys and young men are institutionalized, compared to only 7 percent of white boys and young men. Another factor to acknowledge is the impact of parents’ incarceration in black youth’s family stability and structure.
• Parenthood. Nearly one-third (31.2 percent) of disconnected Latinas are mothers. When connected, Latinas are less likely to be mothers than black and Native American girls, but once disconnected, they are by far the most likely.
• Education. Staying connected to school appears to be a disproportionate challenge for Latino youth. Previous MOA research2 found that Latino young men were as likely as white and more likely than black young men to be employed, but less likely than either to be enrolled in school. A third of disconnected Latino males did not complete high school—the highest rate of any group of disconnected young people. Among disconnected girls, Latinas are the most likely to have dropped out of high school (29 percent), followed closely by Native American girls and young women (28.5 percent).
Lastly, black young men face particularly high rates of youth disconnection, regardless of family income. Our study launched on the same day as the most recent research from Raj Chetty et al. on the black-white gap in upward mobility, Race and Economic Opportunity in the United States: An Intergenerational Perspective.
American Indian and black children have much higher rates of downward mobility than other groups. Black children born to parents in the top income quintile are almost as likely to fall to the bottom quintile as they are to remain in the top quintile. By contrast, white children born in the top quintile are nearly five times as likely to stay there as they are to fall to the bottom.
We found similar racial and income divides last year in our report Promising Gains, Persistent Gaps. Even at the highest income levels, the racial differences between disconnection rates hold firm—i.e., rich minority youth are still more likely to be disconnected than rich white youth. In fact, white youth living at the poverty line are as likely to be disconnected as black youth living in households with incomes four times the poverty line and Native American youth in households with income five times the poverty line.
In Measure of America’s 2015 report, Zeroing In on Place and Race, we found that the more racial segregation that exists in a metro area, the higher the level of youth disconnection for blacks and the lower the rates for whites. In other words, concentrated residential segregation by race and ethnicity within major metropolitan areas has very negative impacts for black teenagers and young adults, who are more likely than whites to live in low-income neighborhoods with historically under-resourced schools and transit systems, less access to employment, and weaker social networks. White youth in these metro areas, on the other hand, are more likely to enjoy the benefits of their families’ own larger incomes, as well as broader neighborhood advantages—good schools, convenient transport to jobs, a rich array of extracurricular activities, and proximity to other adults with valuable contacts and connections.
The study by Chetty et al. also speaks to the previously mentioned incarceration rates of black boys and men as well as the gender gap in achievement outcomes among black young people. One example is black women’s higher college attendance rates compared to white males, conditional on parental income. Our research corroborates these gender differences within the black population, and this difference is apparent as early as the 16–24 age range. The gap in youth disconnection rates between men and women is largest for black youth. Nationally the rate is 5.9 percentage points higher for black men than black women. In the Philadelphia metro area, the male-female gap is nearly 10 percentage points.
Data for change
The racial and ethnic gaps in youth disconnection rates today are testaments to the historical truth of discriminatory practices in the United States, as well as mechanisms by which inequality is perpetuated in the here and now. Policies that aim to improve outcomes for youth and reconnect them to mainstream society will need to address the roots of disconnection cultivated years earlier.
Underfunded schools have left too many young people unprepared for today’s job market and without the adult guidance and support they need to succeed. Public transportation that skirts around rather than serves low-income communities makes it logistically and financially hard to reach educational, training, and employment opportunities. Residential segregation by race and ethnicity as well as by education and income—the legacy of discriminatory laws and policies—means that too many young people are growing up in neighborhoods weighed down by concentrated, multigenerational poverty, where adults also struggle with connection to work and school, where exposure to violence limits human flourishing, and where youth disconnection is so entrenched as to be normative. And the disproportionate institutionalization of youth of color continues apace at a time when overall incarceration is declining, creating yet another set of barriers.
Solutions are needed that cross these previously fractured systems—schools, criminal justice, banks and lending, philanthropy—and there are excellent local organizations showing that doing so works. It’s also crucial to include youth in their own solutions and engage them in the conversation to create change. The participation of young people in recent workshops and discussions Measure of America has been involved in has revealed often-overlooked issues around trust and transparency. Data can be our guide, helping organizations working to address the problems facing youth to effect real, lasting improvements. We imagine a day where national economic growth lifts everyone up collectively, but know that much work lies ahead.
1 More than a Million Reasons for Hope analyzes youth disconnection in the United States by more than race and gender, revealing important disparities—and developments—geographically. Accompanying the full report is an interactive data tool, where users can explore the data with maps and visualizations.
2 See Kristen Lewis and Sarah Burd-Sharps, One in Seven: Ranking Youth Disconnection in the 25 Largest Metro Areas (2012); Kristen Lewis and Sarah Burd-Sharps, Halve the Gap by 2030: Youth Disconnection in America’s Cities ( 2013); Kristen Lewis and Sarah Burd-Sharps, Zeroing In on Place and Race (2015); Kristen Lewis and Sarah Burd-Sharps, Promising Gains, Persistent Gaps (2017).
A Portrait of Los Angeles County Revisited: Responding to Scholars’ Reflections
This blog post originally appeared in SSRC’s Items on March 20, 2018, and is part of a series of reflections on A Portrait of LA County. You can access the original article here.
By: Kristen Lewis and Sarah Burd-Sharps
We first want to give our sincere thanks to Jennifer Lee, Pedro Noguera, and Kelly Lytle Hernandez and Terry Allen for taking the time to provide commentary on Measure of America’s recent report, A Portrait of Los Angeles County. We are grateful that these leading thinkers were willing to engage with the report and share their views about it. Their reviews come at an ideal time; we are nearing the final stretch of our next report, A Portrait of New York City, and they will see some of their suggestions reflected in it.
Measure of America and human development
Before addressing the three reflections, we want to summarize the conceptual basis for Measure of America. We started Measure of America in 2007 (now a program of the Social Science Research Council) to champion in the United States an idea, human development, that is well-known internationally and has broadened the way in which we understand, measure, and track people’s well-being. This concept incorporates strictly economic metrics, like GDP, but also measures other things—besides money—that expand our choices, opportunities, and freedoms. Over the last decade, we’ve produced several national, state, and local reports, a suite of online tools, and work in the area of youth disconnection. We’ve done quite a bit of work in California over the years, producing two volumes of A Portrait of California (published in 2011 and 2014), as well as human development reports on Sonoma and Marin Counties. This report, A Portrait of LA County, builds on its predecessors and uses the same human development approach and methodology.
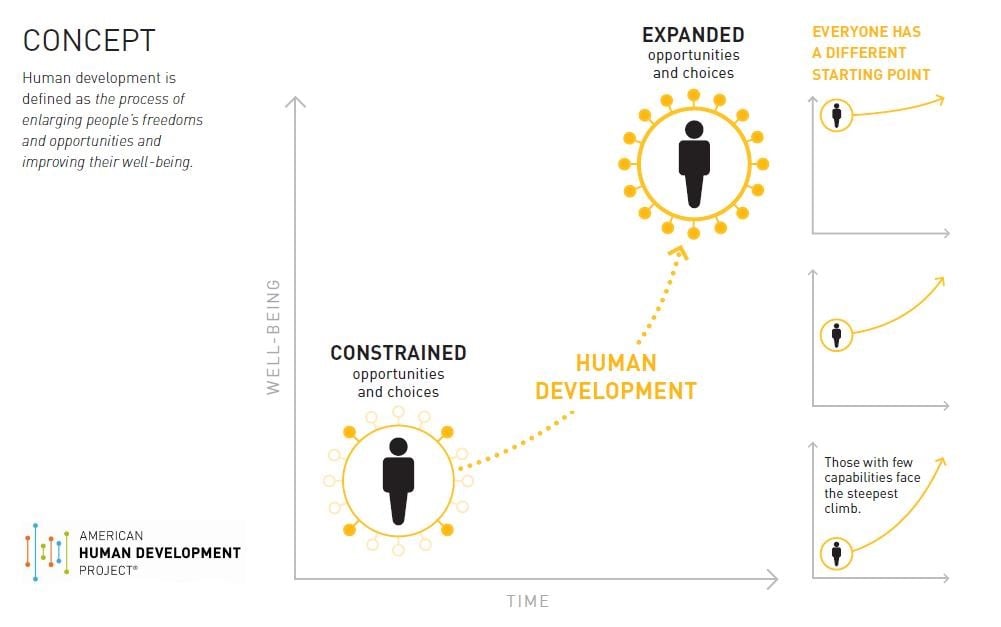
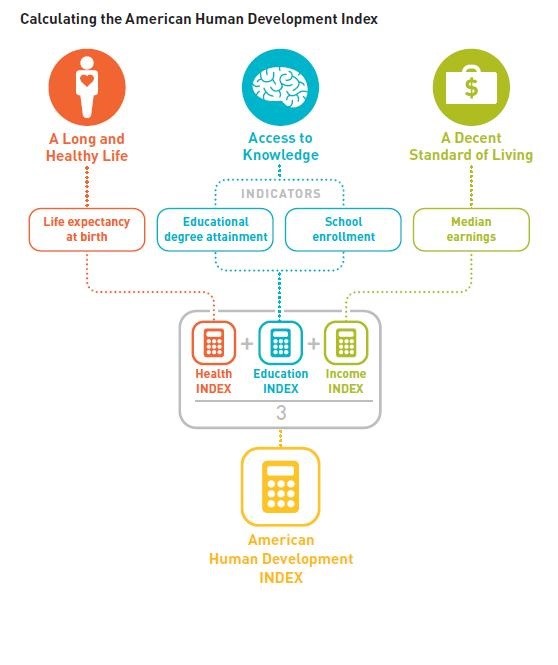
The concept of human development puts people at the center of analysis and considers how political, social, environmental, and economic forces interact to shape the range of choices open to us. It is the process of enlarging people’s freedoms and opportunities and improving their well-being, which is expanded or constrained by the things we do and by conditions and institutions around us, from our family situations to our neighborhoods. At its heart, human development is about what regular people can do and be in their lives. The idea draws heavily on the work of Nobel Laureate Amartya Sen, using his capabilities approach as a conceptual framework. MOA’s American Human Development Index (and UN Human Development Index upon which it is based) measures just three basic human development areas: a long and healthy life, access to knowledge, and a decent standard of living.1 People the world over generally see these areas as the three key building blocks of well-being and access to opportunity.
The portrait
A Portrait of Los Angeles County seeks to explore these questions on human development in the nation’s most populous county, and is the result of a collaboration between Measure of America and over eighty representatives from foundations, governmental, and nongovernmental institutions.2 In addition, the project had the financial support of the LA County Quality and Productivity Commission. It was the first time we had worked with such a large collection of stakeholders on a report of this nature, and the report’s content and focus on timely LA issues was immeasurably enhanced by their inputs.
In the Portrait, we presented American Human Development Index scores for:
• 106 cities and unincorporated areas in Los Angeles County
• the thirty-five community plan areas within the City of Los Angeles
• major racial and ethnic groups, as well as Asian American and Latino subgroups
• women and men
• US- and foreign-born LA County residents
Scores for the 106 cities and unincorporated areas of LA County ranged from a high of 9.43 in San Marino to a low of just 2.44 in Florence-Graham. This seven-point difference is larger than the range among the country’s 435 congressional districts. A resident of San Marino can expect to live an average eight-and-a-half years longer than a resident of Florence-Graham. Following the same pattern, a San Marino resident is sixteen times as likely to hold a bachelor’s degree, as well as have a median income of $77,948 compared to a Florence-Graham resident (with a median income of $18,405).
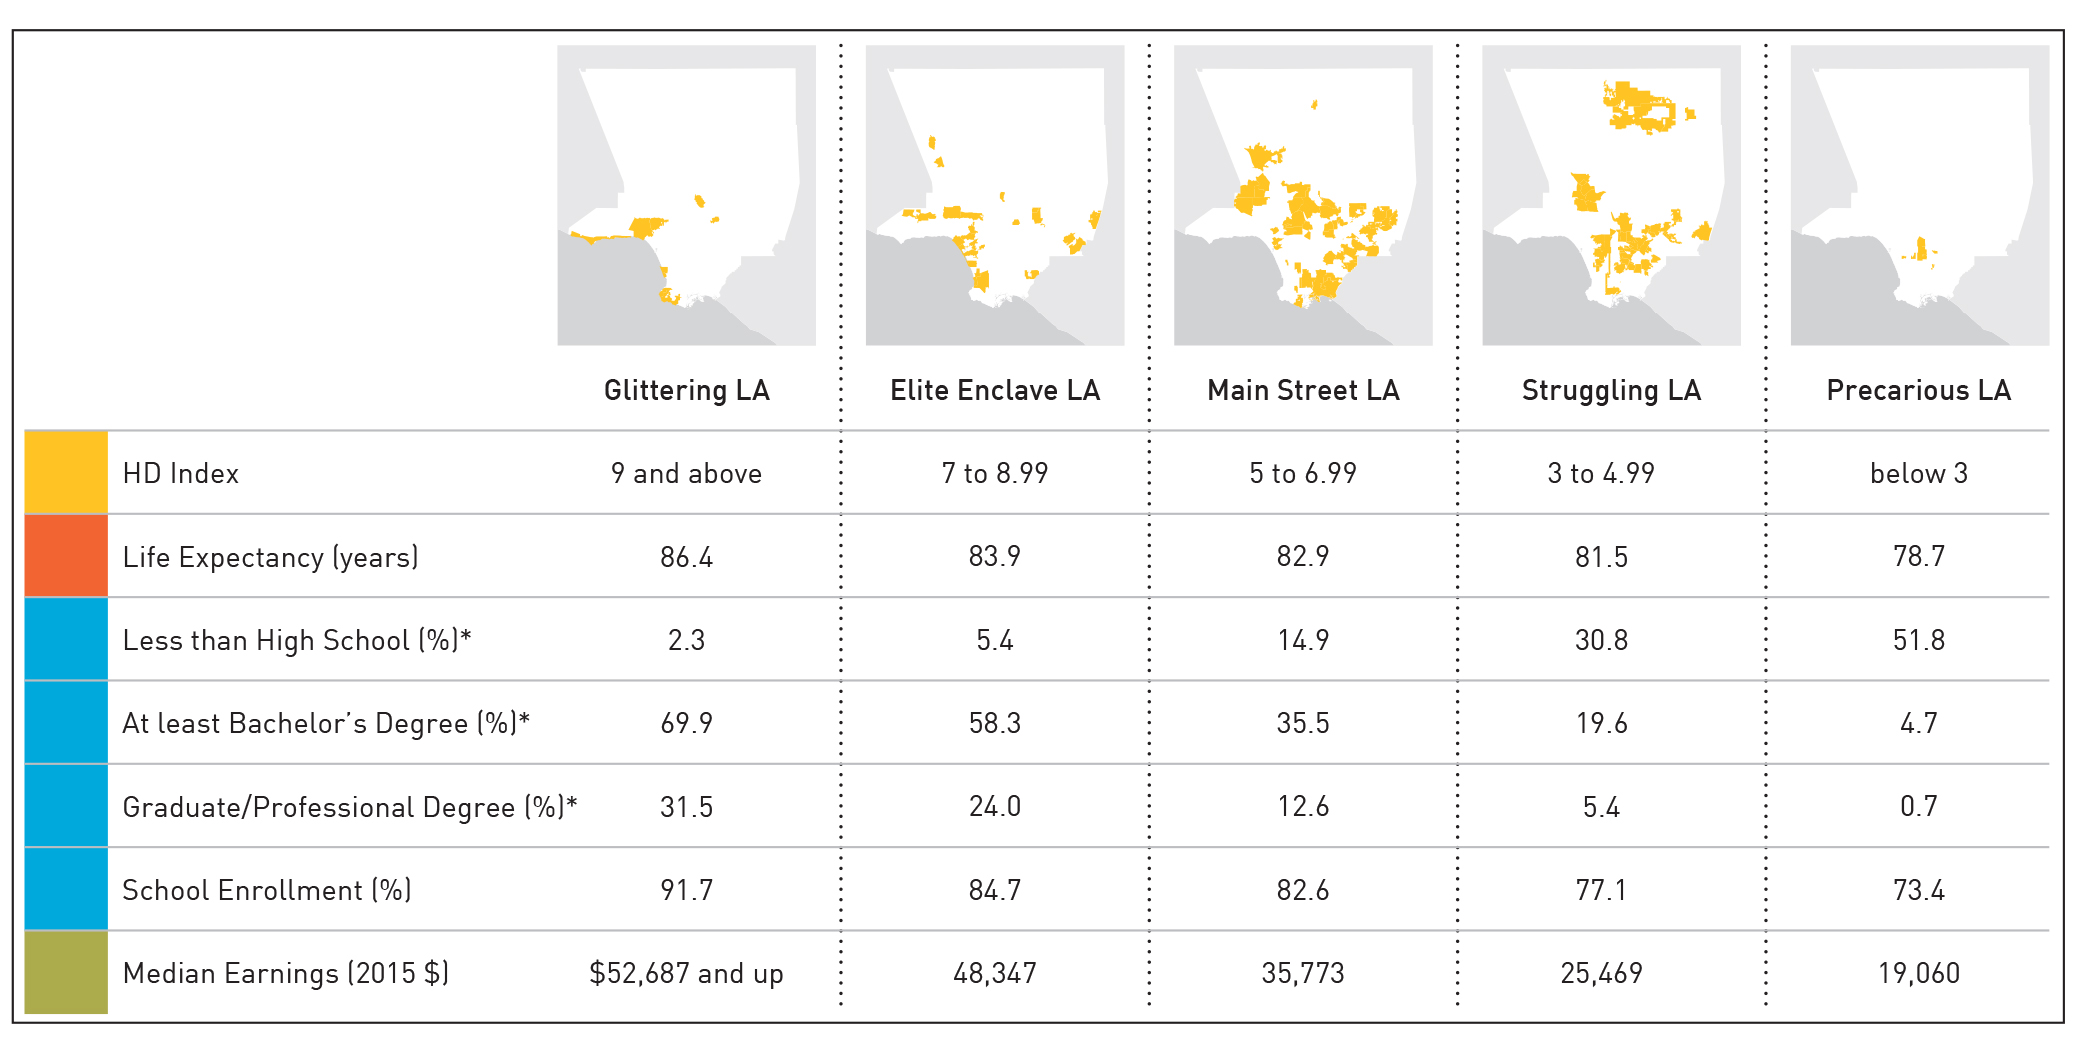
One innovative feature of the report is the “Five Los Angeles Counties” framing. The Five Los Angeles Counties were created by grouping cities and places not by geography or by the standard categorization of income, but by their scores on the 10-point American Human Development Index scale. Grouping communities according to their American Human Development Index score highlights striking differences between the different LA Counties, but also provides a useful tool for looking at what neighborhoods and cities separated by distance have in common.
Listening to the responses
Turning to the commentaries, Jennifer Lee’s book, The Asian American Achievement Paradox, was central to our understanding of educational outcomes among Asian Americans and Latinos in Los Angeles County and informs our current work for A Portrait of New York City. Lee elegantly answers the question of why Asian American children, even those of poor immigrant parents, have better educational outcomes than Latino children of immigrants in Los Angeles by drawing our attention to their wildly divergent starting positions on the educational ladder. The 1965 immigration reforms brought an influx of well-educated Asian immigrants to LA. This social capital (highly educated parents) combined with institutions and practices (like after-school and weekend learning and test-prep centers) positioned second-generation children to succeed in school, even if their parents had low incomes due to language barriers or difficulties transferring their home-country educational credentials to the United States. There was tremendous interest among our partners in data calculations and analysis about Asian subgroups with a view to looking beneath the broad Asian racial category at the strikingly different well-being outcomes within it. Using disaggregated data obtained from the California Department of Public Health and the US Census Bureau, our analysis of the ten largest subgroups revealed that Indians have the highest HD Index score (9.10) and Cambodians the lowest (5.17).
Pedro Noguera raised some concerns in his response about insufficient attention to the connections across boundaries in Los Angeles County, both geographic (between high- and low-scoring areas of the county) and sectoral (between transportation, housing, and education). One of the great strengths of the human development approach and index is a holistic framing that encourages us to look at issues in the interconnected ways in which people experience them rather than as siloed problems requiring separate solutions, and so we were surprised that this did not come out clearly in his reading. We strongly agree that both communities and sectors are interconnected, that the road to a better future runs through a deeper understanding of our shared challenges and shared fates, and that convincing “Glittering” and “Elite Enclave LA” to care about and invest in “Precarious” and “Struggling LA” is imperative to everyone’s well-being in the long run. We share Noguera’s view that, left unchecked, the county will “find itself on an unsustainable path if many of the economic and social trends identified in the report are not addressed.” We would argue that LA is already firmly on, and rather far down, that path, in fact. However, as Noguera argues, we could have made these points more forcefully and will be more explicit about them in the future.
One example of how we hope the Human Development Index will be used is the commentary of Kelly Lytle Hernandez and Terry Allen, who pair it with other data as a way to connect issues and explain the “why” behind the index score. They gathered additional data, research, and analysis on incarceration rates, trends, and policing in LA County, creating a new category, “Caged LA,” and combined their data with that on “Precarious LA” and “Struggling LA.” We are incorporating the question of incarceration and who shoulders its costs into the “Five New Yorks” framing that will be part of the upcoming A Portrait of NYC. The greater New York results are similar to the LA results, with incarceration a normalized experience in the neighborhoods of “Precarious New York” and for all practical purposes utterly absent from life in “Gilded New York” (the East Coast equivalent of “Glittering LA”). Overall, these rich commentaries remind us that while the Human Development Index score shines a light on where a community or demographic group falls on the well-being continuum, it is only the start rather than the end of the conversation.
1 The index combines a small set of indicators—life expectancy, educational degree attainment and enrollment, and median personal earnings—into a single number that falls on a scale from zero to ten, ten being the top score. We then disaggregate the population by geography and by demographic group.
2 Measure of America collaborated with fourteen local philanthropic foundations, the Southern California Grantmakers, and three Los Angeles County departments: the Office of Child Protection, the Department of Children and Family Services, and the Department of Public Health.
Access to Freedom: Caged LA
This blog post originally appeared in SSRC’s Items on February 20, 2018, and is part of a series of reflections on A Portrait of LA County. You can access the original article here.
By: Kelly Lytle Hernandez and Terry Allen
A Portrait of Los Angeles County, a report by the SSRC’s Measure of America program, provides an overview of well-being and equity across Los Angeles County. In particular, the project uses the American Human Development (HD) Index to score and map how LA County communities are faring across “a range of critical issues, including health, education, living standards, environmental justice, housing, homelessness, violence, and inequality.” As a measure of how “ordinary people are doing,” the report aims to serve advocates and policymakers working to “increase well-being for all county residents and narrow the gaps between groups.”
Key measures of well-being and equity in Los Angeles County that are not included in the report are those related to policing and incarceration. Since the 1960s, mass incarceration has emerged as a common feature of urban life and has functioned as an impediment to racial equity across the United States. As legal scholar Michelle Alexander describes it, mass incarceration is the “New Jim Crow,” the institutional basis for a new caste system that disproportionately impacts Blacks, Latinx, and impoverished urban communities.
This is especially true in Los Angeles County, which operates the largest jail system in the United States. On any given night, more than 17,000 people are arrested and caged across the region’s jails, detention centers, and one penal farm.
The size of the Los Angeles County Jail system is sustained by significant public investments. In fact, public safety, namely policing and incarceration, is the single-largest net expense for both the city and county of Los Angeles. Los Angeles County allocates 42 percent of its net spending to public protection. Similarly, the City of Los Angeles commits 56 percent of the city budget to public safety. Together, the city and the county spend nearly $5.5 billion annually on public safety. In other words, local authorities have made policing and incarceration their top priorities for public investment, making the inequities of the New Jim Crow central to any measure of life and well-being in Los Angeles and key to any effort to “narrow the gaps between groups” across the region.
Exposing Caged LA
Based at UCLA, the Million Dollar Hoods research team monitors policing and incarceration trends across Los Angeles County. In particular, we use local police and jail data to map how much is spent per neighborhood on incarcerating residents in the local jail system. We have found that in many neighborhoods more than $1 million annually is committed to locking up residents. We call these neighborhoods Million Dollar Hoods.
Aligning Million Dollar Hood maps with the Portrait’s five community types makes clear that incarceration is a familiar theme of life in “Struggling LA” and “Precarious LA,” the two parts of LA County with the lowest HD Index—3.00–4.99 and below 3.00, respectively. Indeed, the communities where high school graduation rates are low and unemployment rates are high are the same communities where residents disproportionately experience confinement in the local jail system, as well as the subsequent collateral consequences of incarceration. In many ways, Struggling LA and Precarious LA is also “Caged LA.”
Since 2012, residents of Caged LA have collectively spent at least 2,984 years in jail with 2.3 days marking the median period of individual confinement. For many, jail time means extreme emotional stress, family strain, health challenges, and a loss in wages. Had the Portrait incorporated data on incarceration in LA County, it could have highlighted how incarceration exacerbates the crises faced by residents of Precarious and Struggling LA. It should come as no surprise that the areas in LA with the lowest HD Index scores and highest unemployment and youth disconnection rates—young people ages 16–26 who are neither working nor in school—are part of Caged LA. In fact, the two populations (Black and Latinx) who are disproportionately impacted by incarceration in LA County have the lowest median personal earnings, with Latinx residents earning the least ($22,600). Mass incarceration depresses community life, reduces earning power, and impairs access to opportunities.
The price of freedom in Los Angeles County
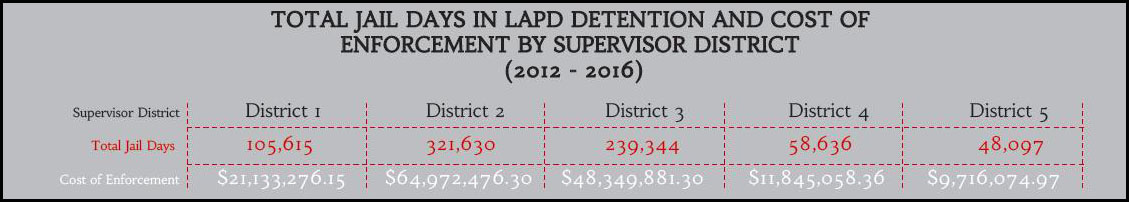
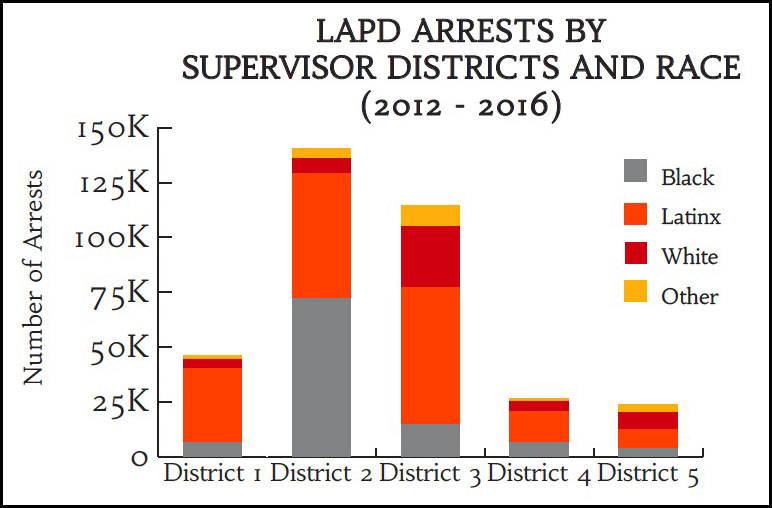
Residents of Caged LA have also disproportionately experienced the collateral expenses that so often accompany incarceration, even when confined for just a few days. For example, our research shows that local residents arrested between 2012 and 2016 by the Los Angeles Police Department (LAPD) were levied an estimated $19.4 billion in money bail. Of this, an estimated $193.8 million in nonrefundable bail bond deposits were paid to bail bond agents by arrested persons or their loved ones. These payments were not evenly distributed across the county in Caged LA. In fact, as figures 1 and 2 show, residents of Los Angeles County Supervisor Districts 2 and 3 paid the most in money bail (see figure 3). They also, collectively, spend the most time in jail. In turn, policing and incarceration make residents in districts 2 and 3 even more vulnerable to debt, poverty, ill health, and reduced educational opportunities.
Figure 1
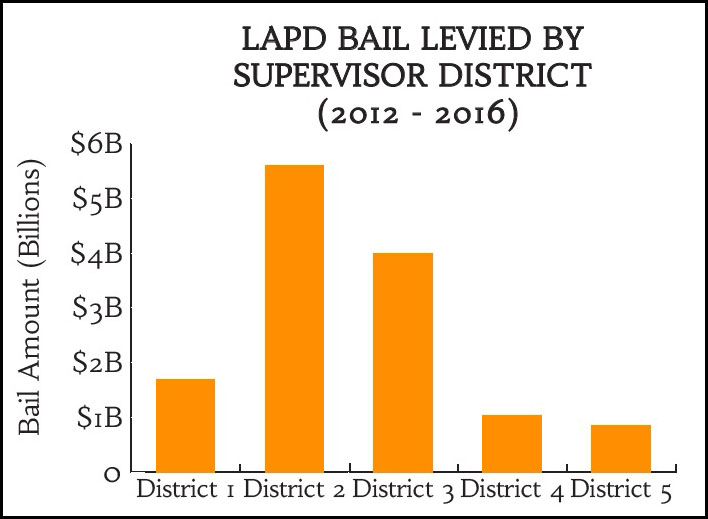
Figure 2
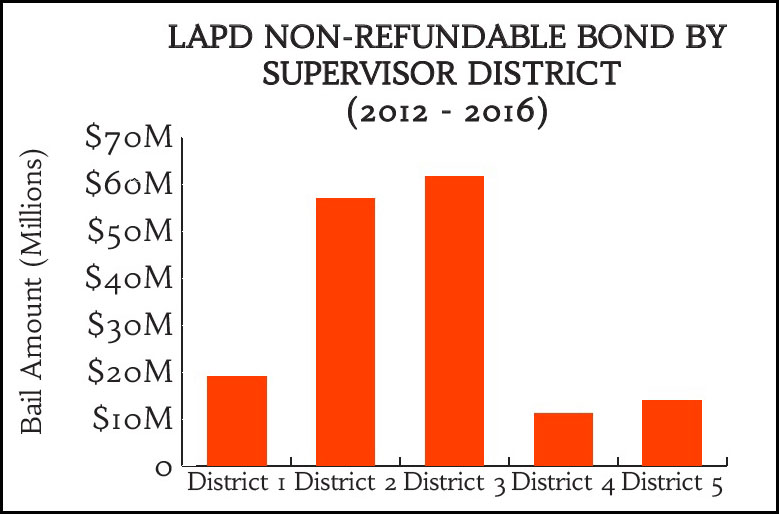
Figure 3
One of LA’s most precarious populations, the houseless (also referred to as homeless), experiences stunningly high arrest rates. As our research with LAPD jail data makes clear, the arrest rate for houseless persons in Los Angeles is more than 10 times that of the housed city population (see figure 4).
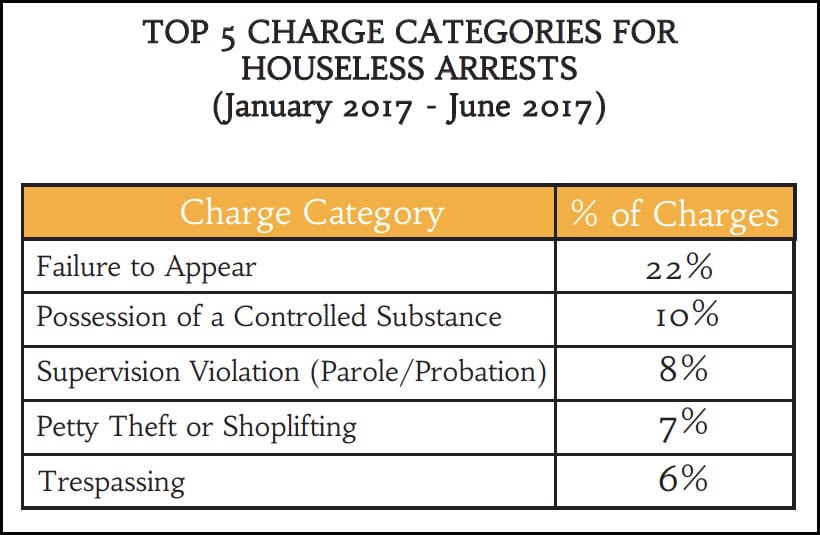
Arrest data does not reveal what drives arrest rates, but the most common charges against houseless persons arrested by the LAPD are nonviolent offenses (see figure 5). Failure to Appear (before a court) followed by drug possession, parole/probation violation, petty theft, and trespassing account for the majority of charges against houseless people arrested by the LAPD.
Figure 4
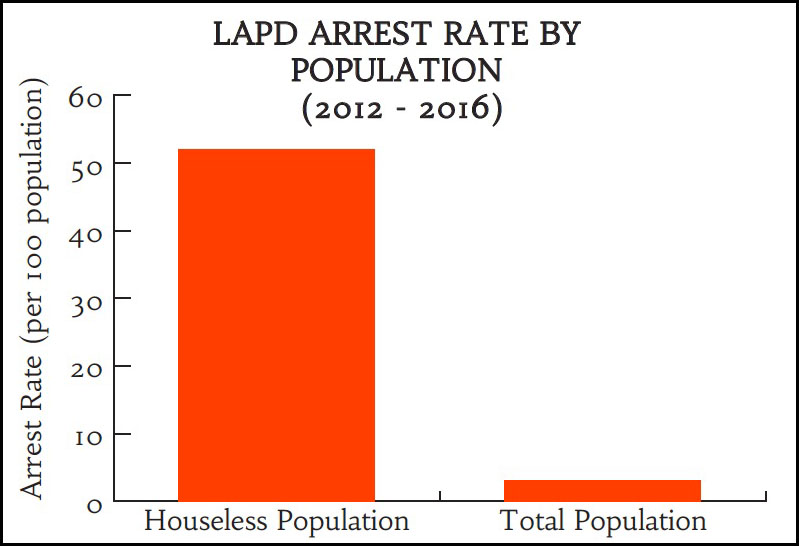
Figure 5
Racial disparities in LAPD arrests are also apparent across Los Angeles County Supervisor Districts (see figures 6–9). In particular, African Americans comprise just 8 percent of the county population but roughly 30 percent of LAPD arrests.
Figure 6
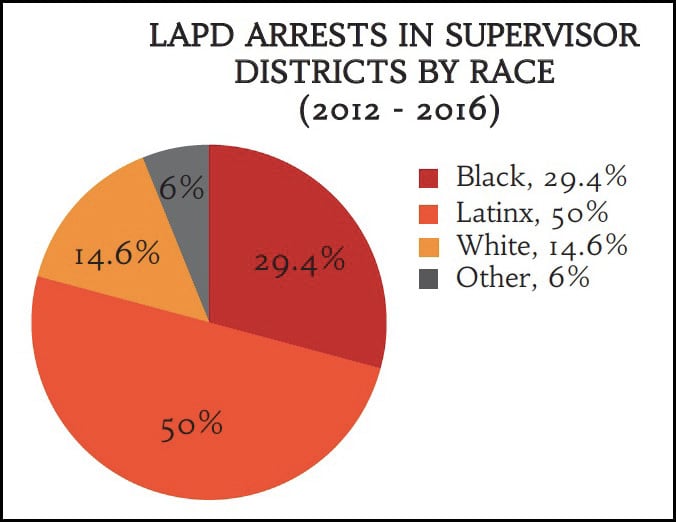
Figure 7
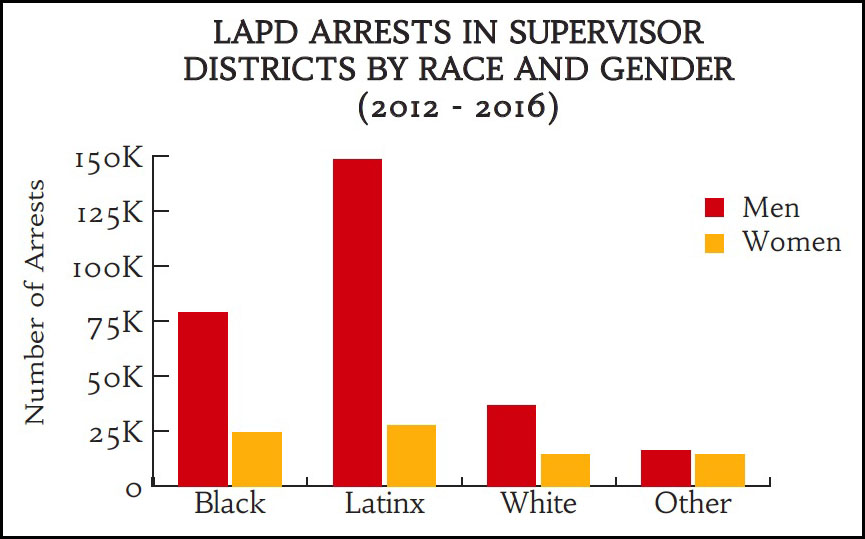
Figure 8
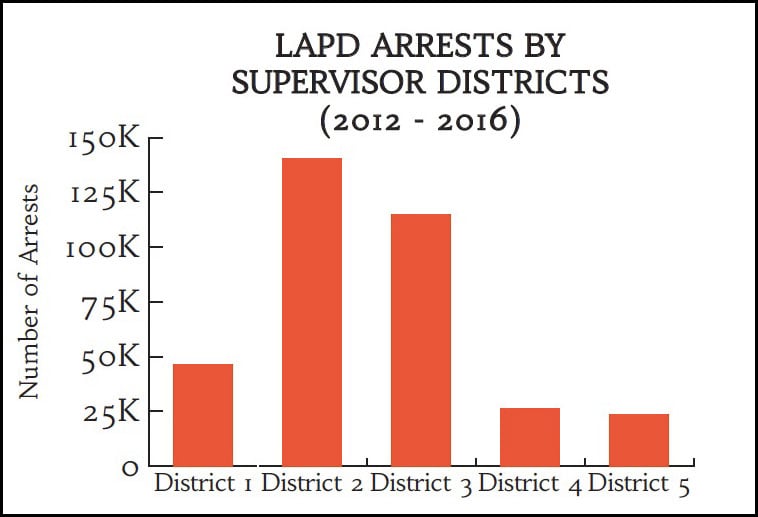
Figure 9
Conclusion
With public safety comprising the leading sector of public investment and mass incarceration constituting a systematic barrier to racial equity, incarceration trends are a critical measure of equity and well-being in Los Angeles. The story told by mapping local jail data is clear: the inequities of incarceration exacerbate racial disparities and economic struggles in Struggling LA and Precarious LA. This story extends beyond LA County and illuminates the crisis caused by mass incarceration throughout the United States. Decades of scholarship have powerfully explained the disparate impact of mass incarceration on racialized communities and individuals, namely Black and Latinx. Just as confronting the rise of mass incarceration and its deep injustices cannot be addressed by separating race and gender from the structural social conditions of communities, our country’s health, education, and income inequities cannot be solved in isolation from incarceration. As long as these trends persist, the United States will continue to be home to the largest penal system in the world.
About the authors:
Kelly Lytle Hernandez is a professor of history and African American studies at UCLA. She is also the interim director of the Ralph J. Bunche Center for African American Studies at UCLA. One of the nation’s leading experts on race, immigration, and mass incarceration, she is the author of the award-winning book, Migra! A History of the U.S. Border Patrol, and City of Inmates: Conquest, Rebellion, and the Rise of Human Caging in Los Angeles. Currently, Lytle Hernandez is the research lead for the Million Dollar Hoods project, which maps how much is spent on incarceration per neighborhood in Los Angeles County.
Terry Allen is a doctoral student at UCLA’s Graduate School of Education & Information Studies. He is also the Director of People & Culture at FOREFRONT, a nonprofit that focuses on innovative, long-term sustainability projects for undeveloped communities.
Advancing Human Development for All in Los Angeles County
This blog post originally appeared in SSRC’s Items on February 6, 2018, and is part of a series of reflections on A Portrait of LA County. You can access the original article here.
By: Pedro A. Noguera
The recent report, A Portrait of LA County, from the Social Science Research Council’s Measure of America program, provides a clear, if also somewhat disturbing, characterization of life in one of America’s most populous metropolitan areas. The report reveals stunning differences in quality of life that are highly correlated with geography as well as race/ethnicity and the socioeconomic composition of communities. Utilizing the “Human Development Index” as its barometer, the report shows that in critical areas such as health, education, and income, gross inequities limit access to opportunity for many residents of the county and contribute to the persistence of deeply entrenched social and economic disparities. The report also suggests that the fragmentation of the region has created five distinct subregions that face very different prospects and challenges.
Though many aspects of the report are quite illuminating, many of its findings will probably not surprise those who are familiar with the region. The affluent northwest communities of Malibu, Bel-Air, and Brentwood bear little resemblance to the poorer communities in the southeast corner of the county. As is true throughout the United States, economic inequality has profoundly shaped the lifestyles, well-being, and quality of life of LA County residents in the twenty-first century.
Though the portrait is not granular in its detail, it is nonetheless compelling. It succeeds in calling attention to the glaring disparities that impact quality of life throughout the county, exacerbated by rising housing costs, limited educational and economic opportunities, and adverse environmental conditions that are contributing to deteriorating health outcomes for some residents. It also draws attention to the plight of the county’s most vulnerable residents and makes a resounding call for concerted intervention.
Interconnected spaces
Yet, despite the tremendous value of this report, there are two crucial omissions that undermine its value as a resource for decision-makers.
First, the report overlooks how porous the social, economic, and physical boundaries dividing communities are despite decrying the degree of race-class segregation and the pernicious fragmentation throughout the county. There is a degree of interconnectedness that many residents fail to comprehend. By attempting to disaggregate patterns and trends in order to produce an accurate portrait of the county, the report may very well allow policymakers, and many of the more affluent residents, to cling to the misconception that the fates of the most disadvantaged communities are separate from their own.
While in many respects, separations based on social and geographic boundaries are real and measurable, the recent fires in Bel-Air provide a pointed reminder of how connected we are nonetheless. Though Bel-Air has the highest Human Development Index score in the county at 9.51, homeless people are also known to live in the community in unregulated dwellings. In fact, investigators learned that the fire had been caused by a homeless encampment. The subsequent destruction of over seven hundred homes reminds us homelessness is not a problem that is limited to certain communities.
This is just one of the ways in which a region that appears to be so fragmented by race, class, and geography is actually quite interdependent. Had the report drawn attention to the rippling effects many of the trends identified have upon the entire county, it could have highlighted how some residents who endure conditions that contribute to a lower Human Development Index may pose a threat to the entire region. The recent outbreak of Hepatitis B among many of the homeless in San Diego County should serve as a wake-up call that a similar health challenge could threaten LA County.
Connecting housing, transportation, and education
Second, the report does not issue a clear and unambiguous conclusion and warning that LA County will eventually find itself on an unsustainable path if many of the economic and social trends identified in the report are not addressed. Again, a similar alarm could be issued about the long-term effects of economic inequality on American society generally. But with its dense population and extreme wealth disparities, the damaging effects of these trends may very well create major disruptions to the economic and social fabric of LA County—and perhaps other large metropolitan areas—long before they are experienced elsewhere.
For example, the report could draw greater attention to the ways rising homelessness and the affordable housing shortage will affect the future of the entire county, including communities that appear to be buffered by wealth and geography. The report acknowledges that rising housing costs and gentrification are forcing poor and working class people to move further away from their jobs and to endure longer commutes to work. But increased traffic congestion is only one of the problems related to this trend. Long commutes operate as an unofficial tax in time and money borne disproportionately by low-wage workers. Some of these workers (e.g., construction workers, gardeners, restaurant workers, and domestics) provide essential services to the wealthy communities and residents in the county. Without their services the high quality of life experienced by some residents would not be possible.
Moreover, the report could acknowledge the consequences of growing inequality because of the affordable housing crisis. When workers who are also parents are compelled to leave their homes in the wee hours of the morning to get to their jobs, who makes sure that their children arrive at school on time? Who helps their children with homework, cooks them dinner, or makes sure they are supervised and safe?
Long commutes and the shortage of affordable housing not only affect low-wage workers. Increasingly, it also affects a growing number of civil servants, health-care workers, teachers, and other professionals. How will the vibrancy and viability of the LA economy be maintained in the future if workers who are critical to the functioning of the economy cannot afford to live here and are unable get to work in a reasonable amount of time? In addition, given that increased vehicle traffic is linked to an increase in asthma and other respiratory illnesses, how will we address these health challenges as they grow and become more common?
The amount of productive time lost to traffic congestion is just one of the costs associated with this problem. The departure of families with children is also contributing to declining school enrollment in some school districts. Los Angeles Unified School District (LAUSD)—one of the largest employers in the county—has lost 200,000 students in the past ten years, half of which has been attributed to this trend. The economic toll already being experienced by LAUSD is staggering. Faced with multibillion dollar structural deficits caused in part by rising pension costs and declining enrollments (it is estimated 100,000 children have left for charter schools), the district will soon have no other option than to initiate mass layoffs of teachers and certified staff, a prospect which will likely worsen economic and social conditions in communities that the report describes as part of “struggling LA,” where half of county residents currently reside.
Going further
While education features prominently in the report, both as a feature of the county’s problems and among the potential solutions identified, its recommendations are not sufficiently ambitious. For example, given the vast private wealth in the county and the presence of major institutions of higher education, it could propose the use of education as a means to counter growing inequality. This could be possible through a well-funded strategy that links education and job training to sectors where high-wage job growth is expected, such as information technology and aeronautics. The report wisely calls for expanding access to high-quality preschool. While this is important, it could bring to the front the fact that too many of the county’s poorest communities lack good schools at all levels. Additional recommendations could be: a call to launch an effort to strategically replace ineffective, under-enrolled schools with a new generation of schools that provide state of the art education and training in STEM, health sciences, and other fields with likely high-wage job growth; and a call for a comprehensive strategy to ensure schools in low-income areas are equipped with a broad range of health and social services so that they are better able to respond to student needs.
Given the likelihood that many of the trends identified in the report will continue, and in some communities contribute to further deterioration in the quality of life, it is important to acknowledge the deleterious implications. Perhaps by sounding the alarm even more deliberately than it has, the report could prompt policymakers and business leaders to recognize that the trends identified pose a threat to all and not just the economically disadvantaged. A true portrait of Los Angeles should remind us that our fates are connected and that we have the resources to create a future that is much brighter than the present.
About the author: Pedro Noguera is a distinguished professor of education at the Graduate School of Education and Information Studies at UCLA. His research focuses on the ways in which schools are influenced by social and economic conditions, as well as by demographic trends in local, regional, and global contexts. He is the author of twelve books.
It Takes More than Grit: Reframing Asian American Academic Achievement
This blog post originally appeared in SSRC’s Items on January 23, 2018, and is part of a series of reflections on A Portrait of LA County. You can access the original article here.
By: Jennifer Lee
Americans rely on status markers like our college degrees, jobs, cars, homes, zip codes, and (if you live in Los Angeles) area codes to measure success. We also like to believe that those who are successful earned it through hard work, smarts, and grit. After all, this is what we learned from the American Dream, and it is how we justify why some people and groups are more successful than others.
Take education, for example. In Los Angeles, Asians graduate from college at higher rates than all groups, including Whites. More than half (51 percent) of Asians in LA have at least a college degree compared to 48 percent of whites, 26 percent of blacks, and 12 percent of Latinos. Most of us are no longer surprised by findings like these. We hear and read about the exceptional educational outcomes of Asian Americans when colleges and universities—especially Ivy Leagues—release their latest admissions figures.
Asian Americans make up more than one-fifth of the entering classes in Ivy League universities like Harvard, Yale, Princeton, and Columbia yet are only 6 percent of the country’s population. In prestigious public universities like the University of California, Berkeley, they comprise more than 40 percent of the student body. These figures would be unremarkable if Asian American students uniformly hailed from high socioeconomic backgrounds, but this is not the case. Even the children of Chinese immigrants and Vietnamese refugees whose parents have less than a high school education graduate from college at nearly the same rate as their middle-class peers, pointing to a vexing Asian American achievement paradox.
Unable to explain the achievement paradox, pundits and commentators of varying political persuasions point to Asian culture: there must be something essential about Asian culture that drives such extraordinary educational outcomes. New York Times columnist Nicholas Kristof devoted a Sunday column to the so-called “The Asian Advantage.” He even cited our book, The Asian American Achievement Paradox, but in the end, Kristof concluded that Asian American academic achievement can be explained by “East Asia’s long Confucian emphasis on education,” “hard work, strong families and passion for education.” How else could the daughter of poorly educated Chinese factory workers raised in an impoverished neighborhood buck the odds and graduate from Harvard?
Disaggregating Asian: Not all Asians excel
As compelling as this narrative may be, it misses the mark. The cultural roots of Asian success are much less plausible when disaggregating the category of “Asian.” Drawing on Measure of America’s report, A Portrait of Los Angeles County, examining differences among and within Asian ethnic groups complicates the stereotypical view of Asian American educational success in two key ways.
First, not all Asian groups—even those who share a Confucian orientation—boast high levels of education. For example, while 72 percent of Indians, 53 percent of Koreans, and 49 percent of Chinese in LA have earned a bachelor’s degree or higher, the corresponding figures for Vietnamese and Cambodians is 30 percent and 18 percent, respectively. Moreover, about one-third of Vietnamese (30 percent) and Cambodians (36 percent) and nearly one-fifth of Chinese (18 percent) do not have a high school diploma. Disaggregating data highlights the enormously diverse outcomes among Asian Americans, who are often studied as a monolith.
Second, international comparisons are useful points of reference. If culture can explain the high achievement of some Asian groups, then we should expect these groups to excel in the greater United States and abroad, but this is not the case. While Koreans in the United States exhibit high educational outcomes, Koreans in Japan fare poorly. Moreover, unlike second-generation Chinese in the United States, their counterparts in Spain exhibit the lowest educational aspirations and expectations of all groups, as Alejandro Portes and his colleagues have shown with their research. Despite the disconfirming evidence, culturally essentialist explanations that point to Asian culture and values thrive in popular discourse.
The hyper-selectivity of Asian immigration
In our book, The Asian American Achievement Paradox, Min Zhou and I tackle this argument head on, and assert that there is nothing essential about Asian culture or values that promote exceptional academic outcomes. Rather, the cultural manifestations of Asian American achievement have legal and structural roots—namely the change in US immigration law in 1965 that altered the socioeconomic profiles of Asian immigrants. Privileging those with high levels of education and skills, the Immigration and Naturalization Act of 1965 ushered in a stream of highly educated, highly skilled immigrants from Asia.
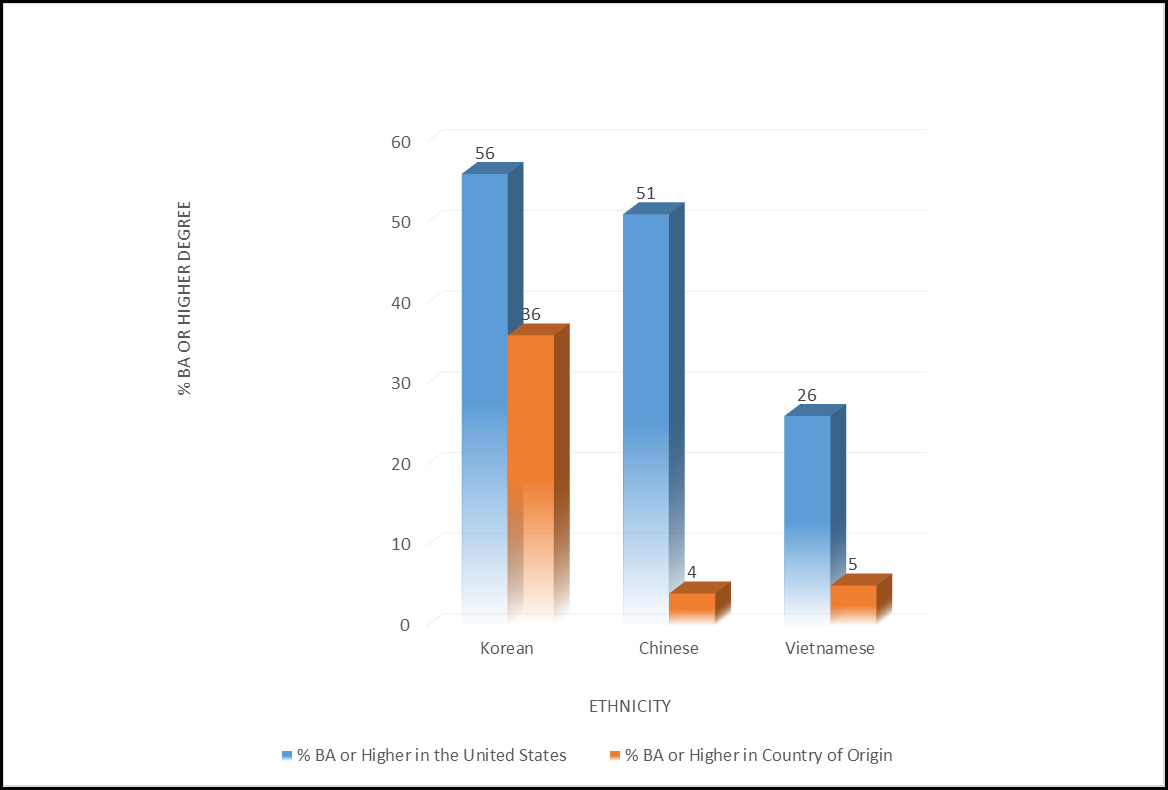
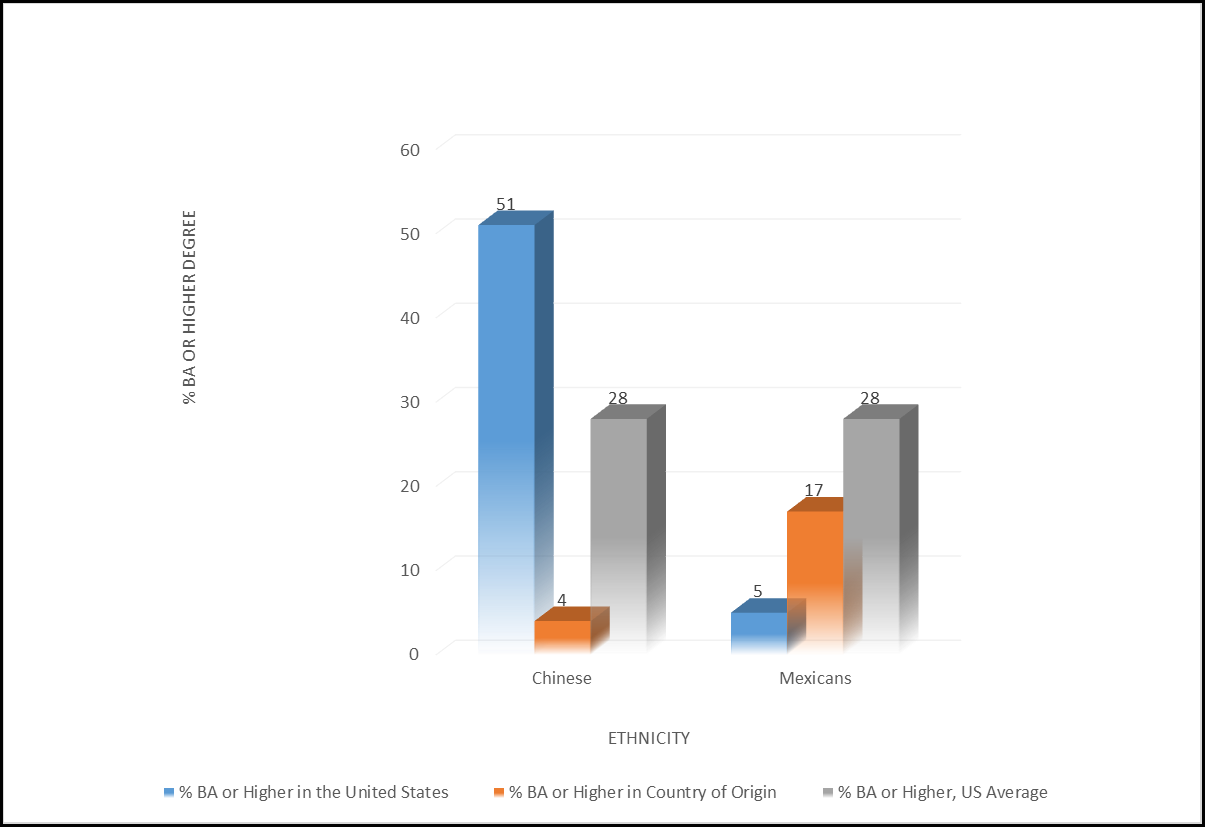
The change in immigration law explains why contemporary Asian immigrants are, on average, highly educated and highly selected. For example, 51 percent of US Chinese immigrants have a college degree compared to only 4 percent of adults in China, meaning that Chinese immigrants in the United States are more than 12 times as likely to have graduated from college as their non-migrant counterparts. In addition, they are more highly educated than the general US population, 28 percent of whom are college-educated. We refer to this dual positive immigrant selectivity as hyper-selectivity, and as figure 1 shows, we find similar patterns for Korean immigrants in the United States. While Vietnamese immigrants are less likely to have graduated from college than the US mean, they are still positively selected compared to their non-migrant counterparts.
Figure 1: Educational achievement by ethnicity
The success frame for achievement
Hyper-selectivity has both direct and spillover effects. First, hyper-selected immigrants import class-specific cultural frames, institutions, and mindsets from their countries of origin, including a strict success frame. The frame not only spells out a clear definition of success, but it also lays out a clear pathway to achieve it.
The success frame entails earning straight As, graduating as the high school valedictorian, getting into a top school (defined as a University of California campus or an Ivy League school), and then working in one of four professions—medicine, law, science, or engineering. In metropolitan areas like Los Angeles and San Francisco that have witnessed a steady influx of hyper-selected Asian immigrants, grades are recalibrated on an “Asian scale” such that an A-minus is an “Asian F.”
Second, the success frame is supported by supplementary education programs that hyper-selected immigrants import from their countries of origin and recreate in the United States. Chinese, Korean, and Indian immigrants come armed with the human capital and economic resources to create ethnic institutions like after-school academies, tutoring services, and SAT prep courses for their children that boost academic outcomes.
Third, because hyper-selected immigrant groups recreate these ethnic institutions in a range of price points—some of which are freely available in ethnic churches, temples, and community centers—they reach the children of working-class coethnics. Thus, supplementary education (which is typically reserved for affluent and middle-class children) becomes available to the children of factory workers, waiters, manicurists, and taxi drivers.
Here, working-class children and parents learn about the importance of enrolling in Advanced Placement and Honors classes, when to begin preparing for the SAT exam (which some children begin in seventh grade so that they are fully prepared to take the exam in the eleventh grade), and how to navigate the complex college admissions process. These are the spillover effects of hyper-selectivity that help to explain how the daughter of Chinese factory workers who have only a sixth-grade education and do not speak English makes it into Harvard. This is not to deny the hard work, smarts, and grit on the part of students who make it to college, but, rather, a reminder that not all those who work hard, are smart, and demonstrate grit have the same chance of making it.
The hypo-selectivity of Latino immigration
Whenever I give public lectures on Asian American achievement, I often get questions about why Latinos do not form ethnic institutions like Asians. People point to ethnic institutions like after-school programs, and wonder why Latinos—and specifically Mexicans—fail to follow suit. To address this point, I explain that unlike Chinese immigrants, Mexican immigrants are hypo-selected: they are less likely to have graduated from college than their non-migrant counterparts and less likely to be college-educated than the US mean. Only 5 percent of Mexican immigrants have graduated from college, compared to 17 percent of Mexico’s adult population and 28 percent of the US population. This dual negative selectivity is what we refer to as hypo-selectivity. In figure 2, we show how the hypo-selectivity of Mexican immigration compares to the hyper-selectivity of Chinese immigration.
Figure 2: Hypo- and hyper-selectivity
As hypo-selected immigrants, Mexicans lack the resources to build the ethnic institutions that would assuage their children’s disadvantaged starting point, including, in some cases, their parents’ undocumented legal status.
Redefining success
Comparing Latinos to Asians points to yet another problem with the way we measure success. When we compare groups to each other, we overlook the remarkable progress that the children of Mexican immigrants in LA have made. Our research shows that in just one generation, they double the high school graduation rates of their parents, double the college graduation rates of their fathers, and triple that of their mothers.
This is also the case of Latinos in LA more generally, as Measure of America’s report reveals. While Latinos in LA have the lowest educational outcomes of all groups, when we disaggregate the data by nativity, we find significant differences between Latino immigrants and those born in the United States. More than half of Latino immigrants (55 percent) have not graduated from high school, and only 7 percent have graduated from college. US-born Latinos in LA look remarkably different: they are nearly three times as likely to graduate from high school and more than two and a half times as likely to graduate from college as Latino immigrants. The educational mobility of Latinos in LA is astounding, but this point is completely lost when we compare Latinos to Asians.
Many Americans work hard, are smart, and exhibit grit in spades. In spite of this, Americans will not graduate from college at the same rates because we begin the race at different points on the starting line. Moreover, some Americans get extra boosts during the race to help them speed across the finish line. So before we measure someone’s success by their diplomas, jobs, or zip codes, let’s first ask about the diplomas, jobs, and zip codes that came before them.
About the author: Jennifer Lee is a professor of sociology at Columbia University and has published award-winning books and articles about immigration, the new second generation, education, intermarriage, multiracial identification, and race relations.
Measure of America: Humanizing Development in America
This blog post originally appeared in LA Counts on August 22, 2017. You can access the original article here.
By: Marina Recio, Program Assistant, Measure of America
Los Angeles County is blessed with a diverse population, a dynamic economy, a beautiful coastline, and a dedicated community of organizations and individuals invested in making it a better place. The county, like many other US counties, also faces some serious challenges in terms of supporting residents to live fulfilling, productive lives.
So how is Los Angeles County doing, and how does it stack up against other communities? That’s a question that communities across the United States often ask themselves, and the yardstick we use to answer it depends on what we value.
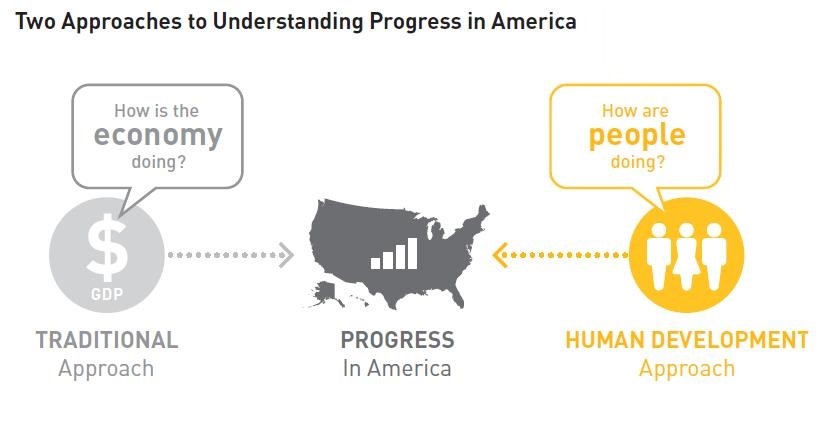
Traditional measurements of development often tell us how the economy is doing. California’s Gross Domestic Product (GDP) per person of $59,000 is virtually the same as that of Wyoming. But there is no doubt that the assets and challenges of each state are unique and by this measure, we fall short of capturing how people are doing. A more holistic approach for measuring people’s well-being brings us closer to finding a better answer.
Rethinking Development: The HD Index is Born
In 1990, a ground-breaking report from the United Nations fundamentally shifted how the world understood development. “People are the real wealth of a nation,” the seminal Human Development Report opened. “The basic objective of development is to create an enabling environment for people to enjoy long, healthy and creative lives.” The influential report introduced a human-centered approach to development and a new tool for measuring progress, the Human Development Index (HDI), a composite index reflecting three essential ingredients of well-being and opportunity: a long and healthy life, access to knowledge, and a decent standard of living. Development around the world would no longer be measured exclusively by GDP per capita, but by what an ordinary person could do or be.
Human development, the brainchild of Pakistani economist Mahbub ul Haq, is defined as the process of enlarging people’s freedoms and opportunities and improving their well-being. At the World Bank in the 1970s, and later as minister of finance in his own country, Pakistan, Dr. Haq argued that existing measures of human progress—GDP in particular—failed to account for the true purpose of development: to improve people’s lives. Dr. Haq often cited the example of Vietnam and Pakistan; both countries had the same GDP per capita—around $2,000 per year—but Vietnamese were living eight years longer than Pakistanis and were twice as likely to be literate. Together with Nobel Laureate Amartya Sen and other gifted economists, Dr. Haq published the first U.N. Human Development Report, which ranked countries using the HDI. Every year since, the United Nations Development Programme office has published a Human Development Report.
The world quickly adopted the HD Index as the gold standard for quantifying development. Many countries made the HD Index an official measurement of well-being; others began publishing their own annual national human development reports. One notable exception was the United States. In the wealthiest nation on Earth, the concept of “development” had been typically regarded as exclusive to developingcountries, irrelevant to our developed nation, and progress in the United States had been defined largely in purely economic terms, with GDP per capita as one of the most common yardsticks. This, however, would soon begin to change.
From GDP to American HD Index: A New Approach for the United States
In 2008, important conversations about inequality and access to healthcare were surfacing to the mainstream; in the midst of the financial crisis, there was growing demand for a new way of understanding progress beyond GDP. Two former career U.N. professionals, equipped with years of experience working on development issues, saw an opportunity to introduce the human development approach to the United States. Nearly two decades after the U.N. released its first Human Development Report, Sarah Burd-Sharps and Kristen Lewis published the first national human development report for the United States.
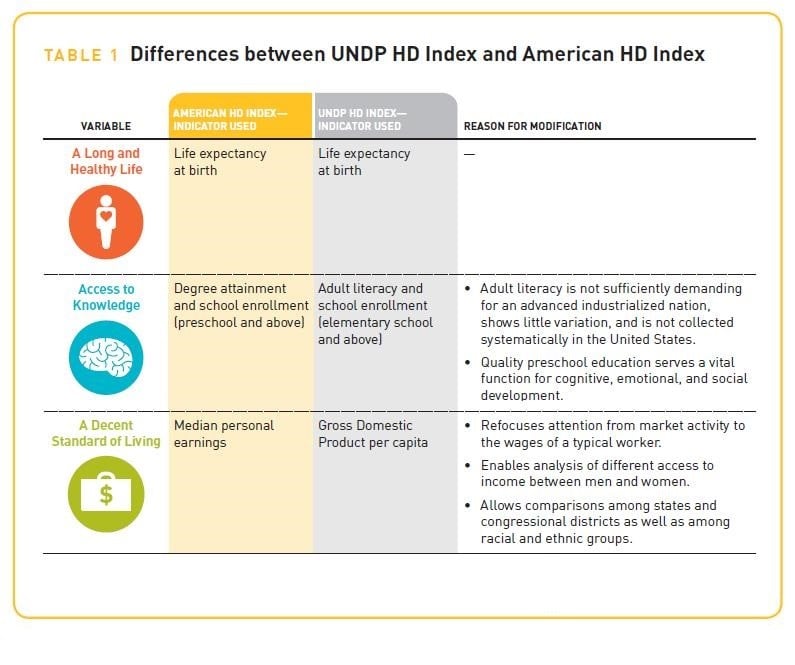
The Measure of America: American Human Development Report, 2008-2009, the first of its kind, introduced the American Human Development Index (AHDI), an adaptation of the HD Index for the United States. The American HD Index measures the same three fundamental areas of well-being—a long and healthy life, access to knowledge, and a decent standard of living—using indicators more appropriate for an affluent, developed nation (see Table 1 for more details on modifications). Burd-Sharps and Lewis have since published three more national human development reports for the United States and several more for individual states and counties—including California, Marin County, and Sonoma County.
Looking Ahead: A Steady Shift Towards Well-Being
In 2008, former French President Sarkozy convened a commission to outline the limits of GDP and to explore alternative measurements for social progress. Their report gave momentum to the “Beyond GDP” movement and It is now conventional wisdom that GDP does not tell the full story, and that measuring things like the health, education, and the standard of living of ordinary people are just as important as market growth. Now more than ever, the human development approach and the AHDI can be powerful tools to assess how Americans are doing and design policies aimed at improving ordinary people’s lives.
Today, Measure of America, a project of the Social Science Research Council headed by Burd-Sharps and Lewis, creates easy-to-use yet methodologically-sound tools for understanding the distribution of opportunity in America, using the human development approach as its conceptual framework. The project produces an annual national human development report and similar reports for states, counties, and cities featuring its hallmark American HD Index for different populations, as well as thematic reports on particular well-being issues like youth disconnection and discriminatory lending, and interactive websites like DATA2GO.NYC. Our work has already succeeded in making well-being data easily-accessible for communities, informing policy, and influencing philanthropic decision-making. With funding from a consortium of Los Angeles-based philanthropic partners and the Los Angeles County Productivity Investment Fund of the Quality and Productivity Commission, Measure of America is hard at work on A Portrait of Los Angeles County. The report, slated to launch in November 2017, will examine the distribution of well-being and opportunity in the county, putting Los Angeles residents at the center of measuring progress and well-being for cities, unincorporated areas, City of LA Community Plan areas and Council Districts, for racial and ethnic groups, women and men, native- and foreign-born, and other groups. To learn more about the human development approach and find out how your community stacks up, visit our website at: www.measureofamerica.org.