Why Health Data Matters: A User’s Perspective
This blog post originally appeared on HealthData.gov on March 11, 2015. You can access the original article here.
Inveterate innovator Benjamin Franklin once quipped, “An investment in knowledge always pays the best interest.”
That adage holds true today—without doing the work to learn about the world, there is little we can do to change it. The need for actionable data is important enough to be enshrined in our Constitution, within the provision that established the United States Census. Unlike censuses in other countries, which were meant to tax or conscript, the United States Census was the first one designed to empower—it was the basis of representation in Congress and ultimately government spending.
Publicly available data are tremendously valuable and empowering. To give an example close to home, without these data, my organization, Measure of America – a project of the Social Science Research Council – would not have the raw materials necessary for our calculations of life expectancy at birth, youth disconnection, and many other vital measures of the lives of ordinary Americans. These calculations, in turn, provided the public health workforce with important statistics to inform their work. We learned, for example, that California’s Latinos, on average, outlive whites in the state by 3.6 years. Or that in the Baltimore metro area, Asian Americans outlive African Americans in the same city by an average of 17 years (90.5 years vs. 73.4 years).
The hallmark of our work, and product of openly available data, is a measure of well-being and access to opportunity in American communities called the American Human Development Index. It is based on the time-tested index used by the United Nations each year to measure development in every country. This index connects three basic areas of life—health, education, and standard of living—on one scale, allowing well-being comparisons between places and groups.
For health, our American Human Development Index requires life expectancy at birth, a basic summary measure of survival. Using mortality and population data from an agreement with the National Center for Health Statistics of the Centers for Disease Control and Prevention, we have calculated life expectancy at birth for every U.S. state, congressional district, major metro area, and for the major racial and ethnic groups in each of these geographies. These data have been cited in The Lancet, The American Journal of Public Health and over forty other journal articles as well as twenty-six books since we began in 2008. They are the benchmark used by the Organization for Economic Cooperation and Development for international comparisons and have been used by state and local health departments across the country. Illinois has used it to study their aging population, New Orleans to map domestic violence, amongst many others. In short, there is tremendous demand for these data as a basis for research, policy, advocacy, and local actions to build healthier communities. And without the costly investment of public agencies in this data collection, these next steps would not be possible.
Our jobs, and those of many other researchers (from hedge fund analysts and geologists to historians and cancer geneticists), are dependent on the government to collect and make data available that no other organization has the capacity to produce. Without it, we would know much less about the world we live in—and what we can do to improve it.
Domestic Violence: Silence Is Its Greatest Ally
This blog post originally appeared as a commentary on The Huffington Post on February 3, 2015. You can access the original article here.
As many as seven in 10 survivors of domestic violence in the U.S. report that their abusers threatened or hurt the family pet. In some shelters, an astonishing 68 percent of survivors report having been strangled or threatened with strangulation. People whose job it is to provide shelter, legal help, and other services for survivors recognize these two specific forms of control and violence as bright red flags that signal a particularly dangerous pattern of abuse, but the general public typically does not. And even when they fear the worst, most bystanders are at a loss as to what to say or do.
Over the past year, the topic of domestic violence has come forcefully into the public consciousness, spurring national conversations on the need to break the silence around intimate partner violence. The footage of NFL player Ray Rice knocking his then-fiancée unconscious as well as the rapidly growing movements to address sexual assault in the military and on college campuses have made headlines. This has prompted celebrities, athletes, and organizations alike to take a public stand and to urge others to do something deceptively simple that can have a huge impact: talk about it.
As this challenging conversation evolves, it’s important to remember that the problem is bigger than the act of violence itself. Domestic violence has devastating psychological, physical, and economic consequences for those who experience it–and for the children who are exposed to it. Survivors often suffer from a host of long-term physical and mental health problems that have a significant impact on their ability to live a healthy, productive, and fulfilled life. And it’s not something that happens just to other people; one in four women will experience domestic violence during her lifetime, meaning that most of us have violence survivors in our lives, though we may not know it.
In our most recent report, A Portrait of California 2014-2015, we looked at three measures beyond GDP that provide insights into how regular Californians are doing: health, access to education, and earnings. Domestic violence arose as a major factor impacting the well-being of California residents in all three categories. This statistic from this report speaks for itself: in 2013, the number of emergency calls for help in California related intimate partner violence was roughly equal to the total number of all other violent crimes in the state put together. Further, 41 percent of women murdered in 2013 in California were killed in circumstances related to domestic violence, the single largest cause of female homicide in the state.
While our recent focus was on California, domestic violence is, of course, a national problem. Because of the complexity of this particular type of violence–it generally happens behind closed doors, and its victims often have family ties to or are financially dependent on their abusers–it is underreported and under-prosecuted, meaning that domestic violence is even more pervasive than these startling statistics suggest. Domestic violence disproportionately harms women, and men make up the majority of perpetrators. But it can occur among people in many forms of relationships and at many ages–including during teen dating, in LGBTQ couples, and in heterosexual couples where women are the abusers.
Research, including our own, shows time and again that domestic violence is central to any discussion of a long and healthy life. Its toll on the physical and mental health of survivors and their families in California, as in every U.S. state, is staggering. So much so, that we argue that victim services and policies to strengthen and enforce laws, while critically important, are not enough; it’s time for domestic violence to become a national public health issue that is addressed with awareness efforts on par with those around HIV/AIDS, smoking, seatbelt and car seat use, and drunk driving. An incredibly effective way to achieve this is to deploy the reach and power of Madison Avenue.
Such an approach is starting to take hold. The National Football League joined the No More campaign, a national effort to raise public awareness and engage bystanders around ending domestic violence and sexual assault, and is sponsoring deeply affecting ads during football broadcasts, including during yesterday’s Super Bowl. These ads have increased views of NoMore.org by more than 240,000 per month. This is an encouraging start; the target audiences of the NFL’s campaign – young people and men – are typically the most difficult to reach on the topic.
But there is much more to be done. Using the sophisticated market research, tailored messaging, and multimedia techniques for which the ad industry is famous, additional high-profile marketing campaigns could sell change in at least three areas.
The first is to challenge beliefs and behaviors about women and men that contribute to intimate partner violence, including cultural messages that exalt a violent model of masculinity, lionize aggressive men as our heroes in popular culture, excuse controlling behaviors as typical parts of romantic relationships, and tacitly or overtly accept violence against women as normal. A public campaign could teach young people that healthy, respectful relationships are cool; violent ones, and violent people, are not. Beliefs and norms can and do change. A generation ago, getting behind the wheel after several drinks was unremarkable, even the subject of jokes. Today, it is not only a crime with real consequences but also a behavior that most people call out as dangerous, selfish, and stupid.
The second is to educate the public about the common dynamics and patterns of abuse that are widely recognized by experts but largely unknown or misunderstood by the general public. Being strangled, for instance, is a telltale warning sign of potentially lethal domestic violence. A campaign that flags strangulation and other widely-observed patterns has the potential to save women’s lives and protect countless others, especially children, from the harmful effects of family violence.
And the third is to redefine norms about how we bystanders should react and what, specifically, we can do when we see signs of domestic or sexual violence. Expanding and increasing awareness of and access to bystander programs like the successful Green Dot and UpStander initiatives currently provided nationwide and in New York, respectively, is a good place to start.
Domestic violence is a pervasive, complicated public health issue that requires an equally pervasive and multi-layered response. In addition to legislation and survivor support programs, we need the targeted, road-tested messaging of the ad industry to drive national awareness and begin the process of transforming attitudes towards both survivors and perpetrators of domestic violence. The potential for improving the health, well-being, and economic future for the survivors, families, and communities impacted by intimate partner violence is too immense to ignore.
Civic Engagement: One Simple Solution to Youth Disconnection
This blog post originally appeared as a commentary on the Policy Innovations site on February 2, 2015. You can access the original article here.
In 2013, over 2.8 million students in the United States were the proud recipients of bachelor’s and associates degrees. That same year, about twice as many young adults were neither in school nor working. This translates to more than five and a half million young people who were disconnected from both of these anchor institutions. Who are these young people, and what can be done to help get them on track towards a productive and meaningful adulthood?
Our research on this topic shows that the high personal costs of youth disconnection—teenagers and young adults ages 16 to 24 who are neither in school nor working—are not borne equally. We found racial variation to be tremendous. While about one in eight young Americans in this age range are out of school and work, the rate for African-American young men is one in four, and for Native Americans, the rate is one in five. But another important finding of our research really points the way to solutions that extend beyond a singular focus on workforce readiness and landing that first job. The typical disconnected young person has had a limited, low-quality education and has grown up in poverty surrounded by adults who themselves are also struggling with connection—to employment, to a solid education, and to strong social networks. Put simply: disconnected neighborhoods produce disconnected kids.
In a research project carried out with Opportunity Nation, we examined in-depth one aspect of these challenges: the role social networks play in the lives of disconnected youth. This new research suggests that civic engagement among young people, specifically unpaid volunteering, can play a surprisingly pivotal role in their lives. In fact, the likelihood that a young person is disconnected is cut in half if she or he volunteers with an organization, whether it be a school, church, youth or service organization, etc. This finding holds true for all of the country’s 25 largest cities and for youth of low socioeconomic status, teens and young adults with children of their own, and youth of color. Rates of youth disconnection in America’s 25 most populous cities are here. Volunteering helps them learn or build the social skills and contacts so vital for first entering the working world, staying employed, and advancing in one’s career.
These findings complement and reinforce previous research that has connected volunteering to a whole array of good outcomes for young people, ranging from increased self-confidence and positive social behavior to higher earnings potential and greater job prestige.1
Of course, meaningful volunteer opportunities are not evenly distributed. Young people whose families and neighbors have few ties to mentors or internship and job connections are least likely to have these opportunities. And they are also most at risk of disconnection. So this new research points the way to targeting volunteer and other civic engagement opportunities for youth who are most in danger of falling through the cracks.
Why does Youth Disconnection Matter?
The teens and early twenties are critical years for acquiring the skills and confidence and building the connections so crucial for future success. Research shows that those who struggle to get a foothold as young adults often suffer lasting scars that impact future earnings, financial independence, and physical and mental health for years to come (OECD, 2011). But youth disconnection is also a costly problem for us all. In 2011, disconnected youth cost a staggering $93 billion in government assistance and uncollected taxes (White House Council 2011). Disconnected youth are twice as likely to be on Medicaid. They collect six times as much government support as their “connected” counterparts (Burd-Sharps, 2015).
Some attention has been paid to the impact of the mid-2000s Great Recession on young people. Indeed, the Great Recession was tough on youth employment. But what is clear from our calculations, using Census Bureau data from well before the recession began, is that the numbers of disconnected youth are finally starting to ebb from their high of over 5.8 million in 2010. Yet even when this rate returns to its pre-Recession “low,” there will still remain literally millions of youth living in communities across the nation who are isolated economically, socially, and politically from the mainstream. These communities, and the young people within them, must be reengaged and reconnected if there is any hope of moving the needle on this problem.

Source: Measure of America analysis of U.S. Census Bureau American Community Survey 2006-2013 PUMS.
Measure of America’s work on disconnected youth has made one point abundantly clear. Youth disconnection stems from a host of interlocking factors and has no easy solution. Providing more volunteer opportunities for youth is clearly a great first step. Doing so will help those young people who are disconnected today. But to prevent disconnection in the future, we need to improve conditions and expand opportunities in today’s highly-disconnected communities.
Our alternatives are clear:
- We can pay for success now by investing in supportive interventions with fragile families: high-quality preschool, wrap-around schools for poor children, relevant high-school curricula that includes career, technical education, and links to apprenticeships, and greater assistance for low-income young people to attend and complete college;
- Or we can pay for failure later, picking up the tab for juvenile justice, crime, public assistance and poor health, reducing American competitiveness—all costs of leaving these young people behind.
1 Johnson, Beebe, Mortimer and Snyder, 1998; Yates and Youniss, 1996; Uggen and Janikula, 1999; Jastrzab, Blomquist, Masker, and Orr, 1997.
Bailey, M.J., and Dynarski, S.M., “Inequality in Post-Secondary Education,” in Whither Opportunity? Rising Inequality, Schools, and Children’s Life Chances, edited by Greg J. Duncan and Richard J. Murnane. New York:, Russell Sage, 2011.
Burd-Sharps, Sarah and Kristen Lewis, “One in Seven: Ranking Youth Disconnection in the 25 Largest Metro Areas,” Measure of America, 2012.
Burd-Sharps, Sarah and Kristen Lewis, “Out of School and Out of Work: Youth Disconnection in America’s Cities 2015,” Measure of America, (forthcoming April 2015).
Center for Information and Research on Civic Learning and Engagement (CIRCLE), “All Together Now: Collaboration and Innovation for Youth Engagement,” 2013.
Corporation for National and Community Service, Volunteering As A Pathway To Employment: Does Volunteering Increase Odds of Find a Job for the Out of Work?, 2013.
Jastrzab, J., Blomquist, J., Masker, J., & Orr, L. “Youth Corps: Promising strategies for young people and their communities.” Cambridge, MA: Abt Associates Inc. 1997.
Johnson, M. K., Beebe, T., Mortimer, J. T., & Snyder, M. “Volunteerism in Adolescence: A process perspective.” Journal of Research on Adolescence, 8(3), 309- 332, 1998.
Kahne, J., Middaugh, E., Democracy for Some: The Civic Opportunity Gap in High School. CIR- CLE Working Paper, 2008.
Lewis, Kristen and Sarah Burd-Sharps, “Halve the Gap By 2030: Youth Disconnection in America’s Cities,” Measure of America, 2013.
National Conference on Citizenship, Millennials Civic Health Index, 2013.
Organisation for Economic Co-operation and Development. OECD Social Employment and Migration Working Papers No. 106. Paris: OECD Publishing, 2011.
Putnam, R. D., Frederick, C.B., Snellman, K., “Growing Class Gaps in Social Connectedness among American Youth,” Harvard Kennedy School of Government, The Saguaro Seminar: Civic Engagement in America, 2012.
Uggen, C., and Janikula, J., “Volunteerism and Arrest in the Transition to Adulthood.” Social Forces 78:331-62, 1999.
White House Council for Community Solutions, “Community Solutions for Opportunity Youth.” The $93 billion includes 6.7 million disconnected youth, as this report uses a different definition of disconnected youth.
Yates, M., and Youniss, J., “A Developmental Perspective on Community Service in Adolescence.” Social Development 5(1): 85-111. DOI: 10.1111/j.1467-9507.1996.tb00073.x. 2006.
Measuring Human Progress
This blog post originally appeared as a commentary on the Stanford Social Innovation Review site on December 9, 2014. You can access the original article here.
…
A new report on California highlights how human well-being is a more relevant gauge of progress than economic metrics.
African American men in California can expect to live fewer than 73 years—about the same as the life expectancy of men in Tunisia and Vietnam, countries with far fewer health care resources. Meanwhile, Asian American men in California can expect to live 84.4 years, a life expectancy that bests that of men living in global-well-being-nirvana Sweden by four years. These gaps and others as vast within California rival those that separate the richest and poorest nations. Why don’t we know more about these kinds of disparities—disparities in something so fundamental as being alive?
Americans hear about Gross Domestic Product growth every quarter, retail sales statistics monthly, and stock market figures every 15 seconds. But those economic indicators measure how the economy is faring, not what life is like for ordinary Americans. Using financial indicators alone as a measure of how well Californians, Americans, or indeed any group of people globally, are doing, is insufficient. Worse, it can give misleading signals. By that score, residents of California’s Kern County, which produced $6.2 billion in agricultural output in 2012 alone, should be thriving. Yet one in three children in Kern County lives in poverty, and Kern ranks near the bottom of the list of California counties in terms of human well-being. Metrics that shed light on the lot of everyday people are more relevant gauges of progress than the purely economic metrics that are a constant focus of our attention today.
Some of the benefits of education.
Measure of America’s American Human Development (HD) Index measures well-being and access to opportunity in communities across the United States. The index is a composite measure of health, education, and standard of living adapted from the well-honed and widely referenced Human Development Index developed at the United Nations and informed by Nobel Laureate economist Amartya Sen’s capabilities approach. We have applied it to a range of places and groups including US states, congressional districts, metro areas, counties, neighborhoods, and census tracts, as well as racial and ethnic groups and women and men. The results have helped stimulate more fact-based conversations about the challenges faced by communities across the country.
“A Portrait of California 2014-2015” is the latest application of the American HD Index. The report provides data-based evidence that people’s capabilities strongly determine their real-life choices and opportunities, either enabling them to live freely chosen, flourishing lives, or constricting their range of possible futures.
Let’s take a look at some specific examples to see just how significant a role the three areas of the index measures play in the lives of Californians:
- Health: A baby born today in the neighborhood cluster in Santa Clara County with the highest California HD Index score can expect to live nearly a dozen years longer than a baby born in the Los Angeles County neighborhood clusters with the lowest score.
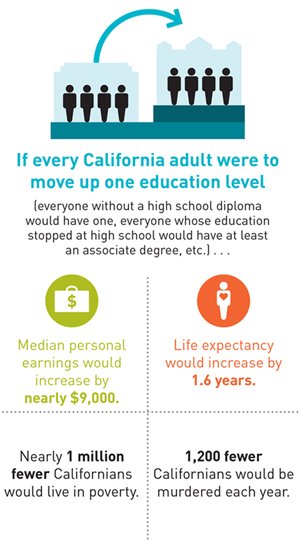
- Education: If we could wave a magic wand and increase educational attainment in California by one level for every resident (i.e. those without a high school diploma would have one, those with a high school diploma would have an associate’s degree, etc.), median personal earnings would increase by more than $7,000, nearly one million fewer Californians would live in poverty, and 1,200 fewer Californians would be the victims of murder each year. In short, education is the closest thing we have to a human development silver bullet.
- Earnings: California’s farm workers make an abysmal $15,000-$17,500 per year for arduous manual labor few other Americans would sign up for. But UC Davis economist Philip Martin showed that raising those wages by 40 percent would only increase the price of fresh produce for the average American consumer by $16 per year. Crop workers could make a decent wage without reducing access to healthy food in a significant way for consumers—a human development win-win.
Health, education, and earnings matter, and making even modest improvements in one area can have a ripple effect across the complete human development spectrum. With that in mind, we have an agenda for action that will help Californians build the capabilities that foster well-being and expand opportunities.
Agenda for Action
Changes in neighborhoods, schools, workplaces, and government can reduce the disparities in health, education, and earnings that divide Californians today and have the potential to raise HD Index scores for everyone—especially groups currently left behind—tomorrow.
The main drivers of health disparities are rooted in the circumstances in which different groups of Californians are born, grow up, work, and age—the so-called social determinants of health. This means that improving the health of Californians first and foremost requires improving the conditions of daily life, especially in communities where risks to health are many and varied—including exposure to environmental toxins, violence, excessive alcohol advertising and poor access to healthy foods.
In terms of education, evidence is mounting that we are waiting too long to reach out to disadvantaged children and their parents. Increasing access to knowledge in the state requires an approach that starts early in life, beginning with efforts to help at-risk mothers have healthy pregnancies and new parents living in poverty build their caregiving skills, and ensuring access to high-quality childcare and preschool for the children of disadvantaged families.
Raising the standard of living requires, of course, reasonable pay for work. Raising the minimum wage and increasing the earnings of farm laborers will change the lives of tens of thousands of families. But we need to address other factors that shape standard of living as well, including the scarcity of affordable housing and protections from unpredictable and unstable schedules for hourly shift workers.
What happens in California has national and even international significance for two reasons. The first is the sheer size of the place: One in every eight Americans lives in California, and if California were a country, it would qualify for a seat at the G8. And the second is the state’s demographics: California is America’s most diverse state and on the cutting edge of the demographic changes that will wash across the country in coming decades. “A Portrait of California” thus offers an intriguing glimpse at America’s future.
INTRODUCING… MOAB!

“Fisher Towers at sunset” by Greg Schaefer. – Own work. Licensed under Creative Commons Attribution 3.0 via Wikimedia Commons
MOAB is a few things. It’s a place in Utah known for views like this one, “Fisher Towers at sunset”, and for some vicious mountain biking. It’s also known in the historical record as a strip of mountainous terrain in Jordan. This is a stretch but we’re gonna do it anyway: introduce our own MOAB, the Measure of America Blog. A pretty decent set of inspirations as we explore the landscape of human well-being in America, tracking the highs and lows… err.. no. Promise, we won’t stretch it too far.
What is Measure of America?
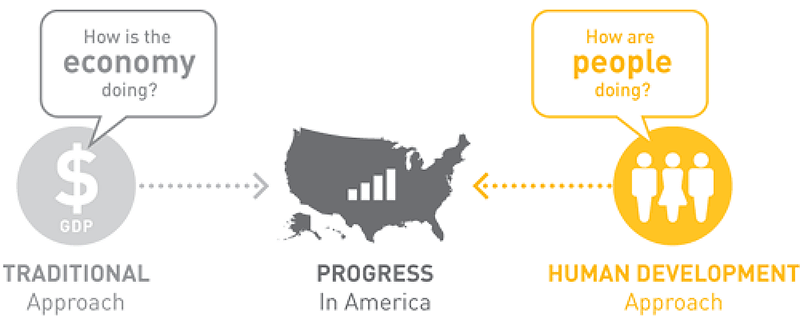
Measure of America, a project of the Social Science Research Council (SSRC), provides easy-to-use yet methodologically sound tools for understanding the distribution of well-being and opportunity in America. Measure of America’s mission is to tell the story of how American people are doing, not just how the economy is doing. We use publicly available U.S. Census data to measure human well-being on a simple 10-point scale.
The concept underlying our work is called Human Development. The late economist Mahbub ul Haq, working with Nobel Laureate Amartya Sen developed the idea in response to government reliance on the commonly used measure of gross domestic product (GDP). They demonstrated that not only that GDP was an inadequate proxy for well-being, but also that attaching such outsized importance to it encouraged governments to measure, value, and even do the wrong things.
A New Way To Measure Progress: The Human Development Approach
The resulting Human Development Index, is known as the gold standard for measuring the well-being of large population groups and a proven vehicle for change the world over. The Index was adapted for use in the US as the American Human Development Index. We just call it The HD Index.
For starters to understand how it works, consider this: GDP, or market activity, rose by more than $10 trillion over the past half-century, a nearly five-fold increase. In the same period, the American HD Index value tripled, representing important progress but considerably less than GDP growth.
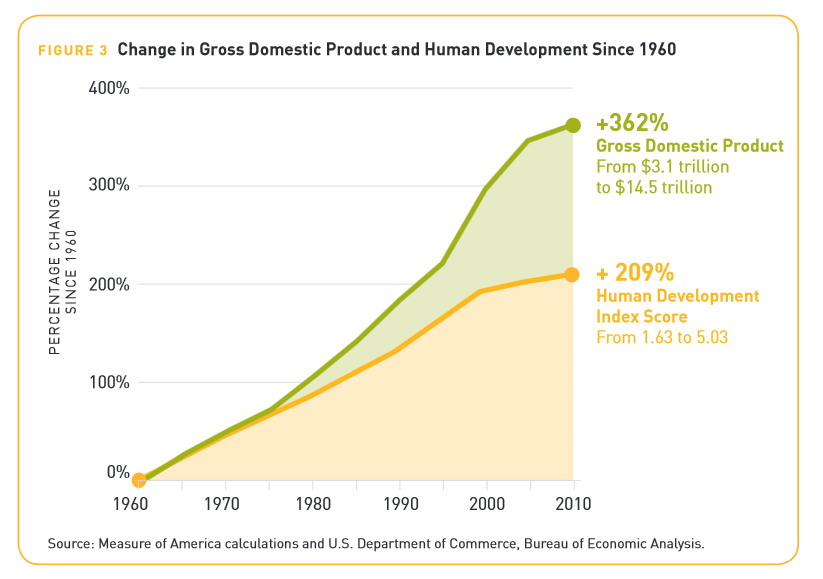
GDP and Human Development: Important progress on both fronts, but PEOPLE lag considerably.
Income inequality is all over the headlines, but it’s clear that income and other money metrics, such as GDP, only tell a small part of the story. Measure of America brings the whole picture to light in three categories: education, health and the ability to earn a decent living. We then break it down to understand what’s happening in each of those areas and why. Too much to tell in one blog post. A good place to start from here is our signature report: Measure of America.
…
STAY TUNED FOR UPCOMING POSTS:
What Real Inequality Looks Like [Or…Tell Us Where You Were Born And we’ll tell you how long you can expect to live]
“What???” It turns out that where you are born and the unique interplay of education, health and access to earning a decent living can tell a lot about life expectancy. Did you know… The longest living people in the United States are Asian Americans in Baltimore, while those with the shortest life expectancy are African Americans born in Pittsburgh. The gap? 18 years. …Inequality is about much more than income.
MOAB and How You Can Use This Blog
MOAB, the Measure of America Blog is organized into these categories: What We’re Learning; What’s On Tap (upcoming publications); What We’re Reading; (our take on) What’s In The News. We’ll set each of those up for you as well as show you a few ways you can use our research to help move the dialogue forward in ways that can make your community better.
Moving the Needle on Youth Disconnection
This blog post appeared as a commentary on the Spotlight on Poverty and Opportunity site on July, 7, 2014. You can access the original article here.
Among the 25 largest U.S cities, the youth disconnection rate ranges from 9.2 percent in Boston to 18.8 percent in Riverside-San Bernardino. The variation of rates from neighborhood to neighborhood within these and other cities, however, dwarfs the variation between them. The starkest inequalities are found in Chicago, New York, and Detroit, in that order, where gaps between neighborhoods are as large as 30 percentage points.
What do these three cities share, aside from high neighborhood inequality? This: Detroit, New York, and Chicago are the three most racially segregated of the twenty-five most populous cities.
Further, our analysis shows that most communities with high shares of disconnected youth in 2011 also had high shares of disconnected youth in 2000, more than a decade earlier—a relationship that holds true even when controlling for population growth and demographic change. The persistence of youth disconnection in low-income, highly segregated neighborhoods where adults struggle with limited education and high unemployment suggests both an absence of effective action on the scale necessary to make meaningful change and the presence of deeply entrenched human poverty, defined as a lack of not just income but also access to knowledge, strong social networks, and civic engagement. It also means that youth disconnection has become a normal and expected experience in these communities. Young people in today’s most disconnected neighborhoods were in elementary school in 2000, and at that time, as many as three in ten teens and young adults in their lives were not working or in school—shaping these young children’s expectations about the future.
Solving the youth disconnection crisis requires three sets of actions. The first step is to actively reengage and reconnect young people who are disconnected today. The second step is to prevent disconnection tomorrow by improving the conditions and opportunities that exist in high-disconnection neighborhoods. The third step is for organizations and individuals active in this area to join together to establish realistic, measureable, time-bound targets for reducing youth disconnection and work collectively to meet them.
This last point is a vital but overlooked key to moving the needle on youth disconnection. To make progress, the diverse actors who work with disconnected young people must not only agree to coordinate, but they should also decide together what success will look like. Setting a goal to halve the national youth disconnection rate from 14.6 percent to 7.3 percent by 2030 is appealing in its simplicity. But a national goal can feel too far removed from the individualized efforts that are needed within each community. A more motivating and meaningful aim would be to cut in half the disconnection gap between neighborhoods and between racial and ethnic groups within each metro area.
What would this mean in practice? In Philadelphia, where the African American youth disconnection rate is 25 percent and the white rate is 9 percent – a gap of 16 percentage points – halving the gap would mean that no more than 8 percentage points would separate African Americans and whites. In terms of Philly neighborhoods, where the highest rate is 30 percent and the lowest 3 percent – a gap of 27 percentage points – halving the gap would mean no more than 13.5 percentage points separating affluent Main Line suburbs from city neighborhoods like Kensington and Richmond.
While these gaps are still too large, meeting goals like these in cities across the country would represent significant and attainable progress—and a more hopeful and promising future for hundreds of thousands of young Americans. The time to act is now. – See more at: http://www.spotlightonpoverty.org/ExclusiveCommentary.aspx?id=19e9820c-b210-4328-a4c9-1cdd74227016#sthash.MI4Ookip.dpuf
The Great Recession may be over, but its pernicious effects endure in the lives of millions of young people. The downturn triggered a surge in the number of disconnected youth—people between the ages of 16 and 24 who are not working or enrolled in school. And especially alarming is the concentration and persistence of disconnection within particular communities, giving lie to America’s promise of equal opportunity
Disconnection from the societal anchor structures of school and work during the transition to adulthood has serious consequences for young people themselves as well as society as a whole. Research shows that young people never entirely recover from long spells of disconnection; instead, they carry scars of their lost years for the rest of their lives in the form of lower wages, worse health, lower marriage rates, greater unemployment, more contact with the criminal justice system, and even less happiness.
Our organization, Measure of America, has worked to document the rate of disconnection within different groups, cities, and neighborhoods. Nationally, about 5 million young Americans were disconnected before the recession in 2007, but by 2010, that figure had swelled to 5.8 million—roughly one in every seven Americans between the ages of 16 and 24. Unfortunately, the tide of youth disconnection has been slow to recede, barely budging from 14.7 percent in 2010 to 14.6 percent a year later, with dramatic variations between racial and ethnic groups as well as between and within cities.
African Americans have the highest rate of youth disconnection (22.5 percent) and are about three times as likely as Asian Americans and twice as likely as whites to be disconnected in their teens and early twenties. Latino young people have the second-highest rate of youth disconnection (17.9 percent).
Among the 25 largest U.S cities, the youth disconnection rate ranges from 9.2 percent in Boston to 18.8 percent in Riverside-San Bernardino. The variation of rates from neighborhood to neighborhood within these and other cities, however, dwarfs the variation between them. The starkest inequalities are found in Chicago, New York, and Detroit, in that order, where gaps between neighborhoods are as large as 30 percentage points.
What do these three cities share, aside from high neighborhood inequality? This: Detroit, New York, and Chicago are the three most racially segregated of the twenty-five most populous cities.
Further, our analysis shows that most communities with high shares of disconnected youth in 2011 also had high shares of disconnected youth in 2000, more than a decade earlier—a relationship that holds true even when controlling for population growth and demographic change. The persistence of youth disconnection in low-income, highly segregated neighborhoods where adults struggle with limited education and high unemployment suggests both an absence of effective action on the scale necessary to make meaningful change and the presence of deeply entrenched human poverty, defined as a lack of not just income but also access to knowledge, strong social networks, and civic engagement. It also means that youth disconnection has become a normal and expected experience in these communities. Young people in today’s most disconnected neighborhoods were in elementary school in 2000, and at that time, as many as three in ten teens and young adults in their lives were not working or in school—shaping these young children’s expectations about the future.
Solving the youth disconnection crisis requires three sets of actions. The first step is to actively reengage and reconnect young people who are disconnected today. The second step is to prevent disconnection tomorrow by improving the conditions and opportunities that exist in high-disconnection neighborhoods. The third step is for organizations and individuals active in this area to join together to establish realistic, measurable, time-bound targets for reducing youth disconnection and work collectively to meet them.
This last point is a vital but overlooked key to moving the needle on youth disconnection. To make progress, the diverse actors who work with disconnected young people must not only agree to coordinate, but they should also decide together what success will look like. Setting a goal to halve the national youth disconnection rate from 14.6 percent to 7.3 percent by 2030 is appealing in its simplicity. But a national goal can feel too far removed from the individualized efforts that are needed within each community. A more motivating and meaningful aim would be to cut in half the disconnection gap between neighborhoods and between racial and ethnic groups within each metro area.
What would this mean in practice? In Philadelphia, where the African American youth disconnection rate is 25 percent and the white rate is 9 percent – a gap of 16 percentage points – halving the gap would mean that no more than 8 percentage points would separate African Americans and whites. In terms of Philly neighborhoods, where the highest rate is 30 percent and the lowest 3 percent – a gap of 27 percentage points – halving the gap would mean no more than 13.5 percentage points separating affluent Main Line suburbs from city neighborhoods like Kensington and Richmond.
While these gaps are still too large, meeting goals like these in cities across the country would represent significant and attainable progress—and a more hopeful and promising future for hundreds of thousands of young Americans. The time to act is now.
The Search for Lasting Solutions
This blog post appeared as the conclusion to Bread for the World’s annual Hunger Report. You can find the Hunger Report here.
Fresno County, California, leads the nation in agricultural productivity, with an annual agricultural output valued at $6.8 billion. Fresno farms yield a cornucopia of fresh food, producing more grapes, chicken, turkey, milk, tomatoes, peaches, plums, and almonds—among others—than any other U.S. county. Paradoxically, Fresno also has a higher rate of food insecurity than any other California county. One in five residents—more than 190,000 people—experience times when they don’t have enough food for an active, healthy life.There’s no better illustration that hunger in the United States is not due to a lack of food than Fresno, a county whose workers literally feed America, yet often cannot feed themselves.
The presence of hunger amid plenty is profoundly troubling, its persistence even more so. If we’re being honest with ourselves, while the composition of the hungry population has certainly shifted over time, we have failed to move the needle on this issue in any fundamental way for more than a decade. U.S. Department of Agriculture statistics show household food insecurity hovering just under 12 percent from 1998 to 2007, after which it rose above 14 percent in the aftermath of the Great Recession. The household food insecurity rate in 2012 was 14.5 percent, which translates to nearly 49 million Americans.
The puzzling part is that this problem endures despite excellent research about the root causes of food insecurity, years of advocacy, important policy reforms, innovative programs on the ground to feed people, the dedication of myriad volunteers, and significant financial resources. Collectively, the government and private organizations spent about $115 billion fighting hunger in 2011. That’s $315 million every single day.
There’s so much first-rate work being done to understand and address hunger in America, and the richest country in the world certainly lacks neither money nor food. We need to figure out how to pull this work together such that it equals more than the sum of its parts.
Measure of America’s aim is to rethink the ways in which we as a society understand and measure disadvantage, with a view to reframing the debate and reengaging Americans in the search for lasting solutions. One way we do this is by using numbers to tell the story of what’s going on with everyday Americans. Measure of America’s American Human Development Index is the cornerstone of this work. Another is to highlight what’s working, not just in the United States but also around the world, to improve well-being and expand opportunity.
In September 2000, leaders from 189 countries met at the United Nations and agreed to work jointly toward eight measurable, time-bound goals to reduce global poverty—goals such as halving the percentage of people who are undernourished, reaching 100 percent elementary school enrollment, and providing access to HIV/AIDS treatment for everyone who needs it. They were called the Millennium Development Goals (MDGs).
The MDG rallying cry did not, of course, solve all of the world’s problems, but it spurred tremendous action and results. The global target to cut the proportion of people living in extreme poverty by half was reached ahead of the 2015 deadline, as were goals on access to safe water, fewer malaria deaths, and better living conditions for slum dwellers. In addition, the world is on track to meet the hunger and tuberculosis targets.
The MDGs were remarkably powerful and successful for many reasons. They helped focus governments and NGOs on achieving a limited set of clear objectives in areas that were central to human well-being, and they made it hard for those who preferred to look the other way to continue denying the existence of severe human deprivation. They galvanized collaboration and brought home the realization that duplication and competition among similar organizations would not get the world across the finish line. They created a more predictable environment in which recipient governments and NGOs weren’t pulled this way and that by constantly shifting donor priorities, making longer-term planning and programming possible. And most importantly, the MDG process put in place a system of accountability in which progress toward the goals was tracked annually and communicated widely. This regular, accessible reporting put persistent divides, such as those between rural and urban areas and between the very poorest and everyone else, into bold relief. The shift from measuring inputs (we lent $2 million, we installed fifty wells, we trained one hundred teachers) to measuring outputs (50 percent fewer people dying of malaria, twice as many girls enrolled in secondary school, half as many people drinking unsafe water) meant that investments had to yield tangible results to count as progress.
The eighth goal involved raising the money to pay for this progress. The flow of foreign aid had dwindled during the 1990s, and the international consensus around the ambitious MDG targets provided a shot in the arm for development assistance. Total development aid went from $79 billion in 2004 to almost $129 billion in 2010 (in constant 2009 dollars).3 Though that sum fell short of what some had hoped for, and funds slowed after the global recession, such an increase had been unthinkable in the business-as-usual scenario.
The MDGs encouraged a wide range of actors to pull in the same direction and provided a clear measure of success. Could those in the United States working to reduce hunger and food insecurity commit to a small set of widely-agreed outcomes—within a set time period— that would focus efforts, increase collaboration, and maybe even stimulate some healthy competition in an area where today too many Americans are paying too little attention? We think it’s worth a try.
Dismal Numbers for Disconnected Youth
This blog post appeared as a commentary in the Huffington Post on July, 9, 2013. You can access the original article here.
At Measure of America, we have charted the share of 16- to 24-year olds in the 25 most populous metro areas who are not working or enrolled in school; they are America’s disconnected youth. Our latest report, “Halve the Gap by 2030: Youth Disconnection in America’s Cities,” shows that 5.8 million youth fit into this category. While youth disconnection is a national epidemic, our research reveals its disproportionate impact on young people of color.
African-American and Latino teens and young adults are far less likely to have a job or to be enrolled in a formal educational program than their white and Asian-American counterparts. The average youth disconnection rate for Latinos is 17.9 percent, compared with 11.7 percent for whites. While Latinos are roughly as likely as other young people to be employed, they are much less likely to be enrolled in school. In fact, 54.6 percent of Latino youth are enrolled in school, compared with the national average of 61.7 percent. African-American youth are nearly three times as likely as Asian-American youth and twice as likely as white youth to be disconnected from employment and school. In contrast to Latinos, the primary challenge for African-Americans is their attachment to the workforce. Nationwide, 61.9 percent of Latino youth are employed, compared with just 45.2 percent of African-American young people.
Analysis at the neighborhood level shows that communities with large percentages of African-American and Latino youth are the most disconnected. In Boston—the metro area with the lowest rate of youth disconnection overall—the rates for African-Americans (14.2 percent) and Latinos (18.6 percent) are much higher than that of whites (7.2 percent). In Washington and Minneapolis—the second- and third-most connected cities—one in every five African-Americans ages 16 to 24 is disconnected. Furthermore, disparities in disconnection rates between neighborhoods in the 25 most-populous metro areas are most pronounced in the cities where residential racial segregation is prevalent. In Detroit, New York, and Chicago—the three most racially segregated cities—disconnection rates vary by as many as 30 percentage points between neighborhoods.
Communities with large shares of African-American and Latino youth are the most disconnected because they face a host of structural and institutional barriers, including poverty and education inequality. Six characteristics strongly associated with disconnected neighborhoods are low human-development levels, high poverty, high adult unemployment, low adult educational attainment, and a high degree of residential segregation by race and ethnicity. Clearly, youth disconnection is an issue that is larger than any single young adult; the problem reflects and reinforces the conditions parents, families, and the larger community struggle with.
The institutionalized drivers of youth disconnection are even more evident when one looks at the data over an extended period. Youth disconnection rates by neighborhood from 2000 are strongly associated with youth disconnection rates today in those same areas. Our report shows that neighborhood-level youth disconnection in 2000 explains about 74 percent of the variation in disconnection in those same neighborhoods at the end of the decade (2011), even after taking into account population growth and demographic change. Entrenched youth disconnection shows that it has become a normative experience in these communities. When the young people who are disconnected today were in elementary school a decade ago, as many as three in 10 teens and young adults in their lives were not working or in school—shaping their own expectations about the future.
Solving the youth disconnection crisis requires reengaging and reconnecting young people who are disconnected today as well as preventing disconnection tomorrow by improving conditions and opportunities in disconnected communities. But to really move the needle on this issue, the actors working to put an end to youth disconnection must join together and establish measurable, time-bound targets for reducing the gaps between racial and ethnic groups and between neighborhoods.
In Philadelphia, the African-American youth disconnection rate is 25.2 percent and the white rate is 8.9 percent—a gap of 16.3 percentage points. The highest neighborhood disconnection rate is 30 percent, and the lowest is 3.2 percent—a gap of 26.8 percentage points. Halving the gap would mean no more than 8.15 percentage points separating African-Americans and whites, and no more than 13.4 percentage points separating neighborhoods. While the gaps would still be large, the needle would be moving in the right direction. Setting clear targets raises awareness, galvanizes resources and action, provides a gauge for assessing effectiveness and progress, and encourages diverse actors to pull together toward the same ends—just what this stubborn problem and the young people affected by it need.
The authors are co-directors of Measure of America, a project of the Social Science Research Council. Their most recent report expands on their 2012 research, “One in Seven: Ranking Youth Disconnection in the 25 Largest Metro Areas.”
Inequality: From Wall Street to Your Street
This blog post appeared as a commentary in the Huffington Post on July, 9, 2013. You can access the original article here.
Income inequality, for years the great unmentionable in political discourse, is suddenly on everyone’s lips. Thanks to the Great Recession, Occupy Wall Street, and the ensuing focus on the “one percent,” the gulf between the richest and the rest is now not only acknowledged, it is being cited by people across the political spectrum as an impediment to economic recovery.
While income inequality is enjoying its moment in the sun, other forms of inequality are getting far less attention. Just as we rely too heavily on economic metrics like Gross Domestic Product to gauge human progress, so too are we taking an overly narrow view of inequality. Mutually reinforcing inequalities in health, environment, education, and wealth have created a large and growing opportunity divide that wages alone cannot bridge. These inequalities have a particularly pernicious impact on disadvantaged children, limiting their life chances long before they cash their first paycheck. Ignoring the ways in which these non-income inequalities take root and multiply is a costly mistake for society. Here are some examples.
Let’s start at the most basic level: being alive. Our research shows that a baby born today in southwest Louisiana can expect to outlive a baby born in parts of New Orleans by seven-and-a-half years. At the national level, Asian Americans can expect to outlive African Americans by a dozen years. Lifespan disparities like these are less about access to doctors and medicine—the focus of our national health care debate—than about the conditions of people’s daily lives. Improving conditions in poor neighborhoods such that families have ready access to full-service grocery stores and parks where children can safely play and exercise can go a long way towards laying the foundation for long and healthy lives. Vigorous public health campaigns to raise awareness of the “fatal four” health risks of smoking, poor diet, physical inactivity, and excessive drinking have great potential for reducing both premature death and health care costs. And policies that increase job security can mitigate the health-eroding chronic stress that Americans living paycheck-to-paycheck experience. Communities where preventive efforts are strong boast some of the world’s longest life expectancies. By contrast, other groups of Americans have life spans on par with those that prevailed five decades ago.
The environments in which different groups of Americans live, right down to the air they breathe, is another sphere of stark inequality. New York City offers an illustrative example. Manhattan, with less than a fifth of New York City’s population, produces over half of its garbage. But when it comes to waste disposal, Manhattan is spared consumption’s downsides. The Bronx has nineteen facilities where garbage and recycling are trucked, sorted, and shipped out; Manhattan has none. With these large-scale garbage facilities come diesel truck pollution, vermin, and cockroaches, all known asthma triggers, making it no surprise that the South Bronx has one of the region’s highest rates of asthma hospitalization. Asthma is a common childhood condition, but it plays out differently depending upon where you live. In some communities, a frantic trip to the emergency room with a life-threatening asthma attack is a mercifully rare occurrence; in others, like the Bronx neighborhoods of Tremont and Melrose, such a trip is all too common. No community welcomes garbage facilities. But the pattern, found across the country, of making poor communities society’s dumping ground is unjust and demands a solution.
Our country has historically placed faith in education as the great leveler, the answer to inequality. Today, that faith is largely misplaced; on the whole, our educational system is doing more to widen than to narrow inequality. In our work in California, we found that the Los Angeles Unified School District (LAUSD) has high schools with top-notch facilities, well-stocked libraries, and advanced coursework options for most students. But LAUSD also has schools with severe overcrowding, outdated facilities, and few advanced courses. These latter schools also typically serve students facing the greatest out-of-school challenges—low English-language proficiency, poverty, gang recruitment, and more. These variations yield strikingly different results. Graduation rates range from above 97 percent in some LAUSD schools to only 56 percent in others. Within the Los Angeles system, and in districts across the nation, schools whose students have the greatest needs tend to get the fewest resources. In an age when the pie is not growing, greater equity in how it is sliced matters more than ever; our current approach of giving the biggest pieces to those who already have a lot makes little sense. Also critical is getting it right from the start. Robust evidence shows that high-quality preschool for disadvantaged children has benefits that last well into adulthood, with less grade repetition, less need for special education, and a lower dropout rate during the school years as well as less incarceration, higher earnings, and higher rates of homeownership later on.
While income inequalities are large and growing, inequalities in wealth—or net worth—are even larger, and arguably more consequential. For example, while African American young people are 43% more likely to get an MBA than their white counterparts, they are one-third as likely to become business owners. Why? A key reason is that the typical white household has twenty times the median wealth of the typical black household. This means that African Americans have fewer savings to invest directly in business and, without collateral, are far less successful securing business loans. While other factors, including discrimination, also shape the fortunes of these young people, greater racial equity in wealth would be a game changer. Unfortunately, while incentives for wealthy families to save and invest abound (think mortgage interest deductions and lower tax rates on capital gains), programs for low-income families are few and far between. Developing such mechanisms (including automatic savings accounts for every child at birth, the option to deposit state tax refunds directly into college savings plans, greater support for homeownership, and others) would go a long way toward reducing the huge wealth inequalities that dampen mobility, stifle entrepreneurship, and limit the horizons of too many young Americans.
Fortunately, the leading causes of premature death are largely preventable, environmental equity can become a priority, educational opportunities can be more fairly distributed, and proven programs to increase asset-building and reduce wealth disparities can be brought to scale. Greater recognition of how inequalities in these four areas interact and reinforce one another is the first step, and concrete action in the form of strong policy measures must follow. Income inequality matters, but it’s just one piece of the puzzle; addressing non-income inequalities as well is key to creating an infrastructure of opportunity that serves the next generation of Americans.
The State of America’s Well-Being
This blog post appeared as a commentary in the Stanford Social Innovation Review on February 28, 2012. You can access the original article here.
As the national debt debate intensifies and public resources become increasingly scarce, determining how best to allocate federal dollars is today’s burning question. So who is making these critical decisions, and how—and how will we know if we’re on the right track? Shaping the path is the 113th Congress, celebrated as the most diverse in history, with more women, people of color, and openly gay or lesbian members than ever before.
Yet our research, which compares Congress to the US population as a whole, shows that members are still disproportionately white and male, and twice as likely to be over age 65 as other Americans. Using as a gauge the American Human Development Index (AHDI)—a composite measure of government health, education, and income data—we find that the divide between representatives and their constituents is vast. Congress as a whole enjoys higher levels of well-being than the highest-ranked state by AHDI: Connecticut.
When it comes to education, more than 95 percent of members of Congress have completed a bachelor’s degree or higher. That number for the US population as a whole is 28 percent. Another fun fact: Members of Congress are 68 times as likely as all American adults to have practiced law.
How does Congress compare to the general population in income? Median annual earnings of American workers ages 16 and older are $29,000. Members of Congress earn $174,000. Put another way, members of Congress earn six times what the typical worker earns annually—and this includes only salaries, not outside income, assets, allowances, or benefits.
The only area in which Congress lags behind the country as a whole is health. The average American can expect to outlive the average member of the 113th Congress by more than one and a half years. The disproportionate number of men (the world over, women live longer) and dearth of Asian Americans and Latinos (the US racial and ethnic groups that live the longest) pull down the average Congressional life span.
OK, so what if Congress is dramatically better off than the rest of us? Don’t we want well-educated people making our laws and allocating our resources? Of course. But we want the same for the rest of America. The real question for our representatives is how to raise AHDI scores across the board so that America’s well-being looks more like Congress’s.
AHDI is a valuable tool for understanding which groups are thriving and which are barely surviving, and where to channel our scarce resources. Rooted in the human development approach, AHDI asks how people—the real measure of American strength and prosperity—are doing. GDP, on the other hand, asks how the economy is doing—and the answer can be misleading. GDP has tripled since 1975, but the big productivity gains that fueled GDP growth have not paid off for the vast majority of Americans; median personal earnings have barely budged in four decades. GDP is increasingly irrelevant as a marker of human progress—the focus of the AHDI.
Congress’s disproportionately high level of well-being means that the majority of its members are detached from the reality of average Americans—people concerned with making the rent, paying for health care, hanging on to their jobs, and living in safe neighborhoods with decent schools for their children. A Congress that reflects the full diversity of American society is more likely to be responsive to its needs. New people bring new ideas, new perspectives, and new information, which spur new solutions. Plus, research shows that diverse groups make better decisions than homogenous groups. So just as we want an America that looks more like Congress in terms of well-being indicators, we also want a Congress that looks more like America in terms of demographics.
So, as they consider budget cuts, what should our representatives do to increase people’s well-being? It’s critical that Congress is not penny smart and pound foolish. It must take a long-term view and understand that there are proven investments we can make now to increase our well-being and global economic competitiveness, save taxpayers money, and reduce our debt.
Congress should invest in fostering the conditions that allowed its members to succeed in their own lives, starting with education. Our representatives, nearly all of who possess at least bachelor’s degrees, have demonstrated the importance of education. Quality preschool has been shown to be the single most cost-effective educational intervention. Congress should start there.
Furthermore, we all know that education leads to better jobs and bigger paychecks. But research increasingly shows that more education also correlates to better, happier, and longer lives for individuals. It also pays big dividends for all of us in the form of increased civic engagement, greater neighborhood safety, more tolerance, and a more globally competitive workforce.
To stay true to our national value of equal opportunity for all, we need forward-looking policies and investments that improve human development outcomes across the board. We need a Congress that represents the people and a tool that can measure real progress in what matters to average Americans: health, education, and economic security. We need to show leadership as a nation in advancing human development, starting by investing in our own citizens’ well-being.
– See more at: http://www.ssireview.org/blog/entry/the_state_of_americas_well_being#sthash.DFuQ0O9W.dpuf