Blog
From Foreclosure to Homelessness, Now You Can Map NYC’s Problems
This blog post originally appeared in City Limits on December 1, 2015. You can access the original article here.
New York City is rich in data resources for understanding the unique assets and challenges of its diverse neighborhoods. But the information available isn’t necessarily comprehensive, up-to-date, easily accessible, or in the right format, so finding the right data and corralling it into something useful can be a challenge. To make a real impact, policymakers, social service organizations, and advocates working on improving policies and programs need reliable, nonpartisan information to understand how a variety of issues interact to shape people’s choices and opportunities – which is why we created DATA2GO.NYC.
DATA2GO.NYC brings together for the first time federal, state, and local data vital to understanding inequality and how multiple factors combine to influence New Yorkers’ well-being in every neighborhood. It’s a free tool for policymakers, community-based organizations, philanthropists, social service delivery agencies, journalists and all people working to improve life in the Big Apple. The website contains 350 indicators of well-being for each of New York City’s 59 community districts, 150 of which are also available by census tract. Many indicators were previously unavailable to the public, such as data on homelessness and philanthropic giving, or unavailable by community district, such as data on crime and voting. Users can create unique maps and visualizations, prepare community district profiles, test relationships between indicators across neighborhoods, and print or share their results at the click of a button.
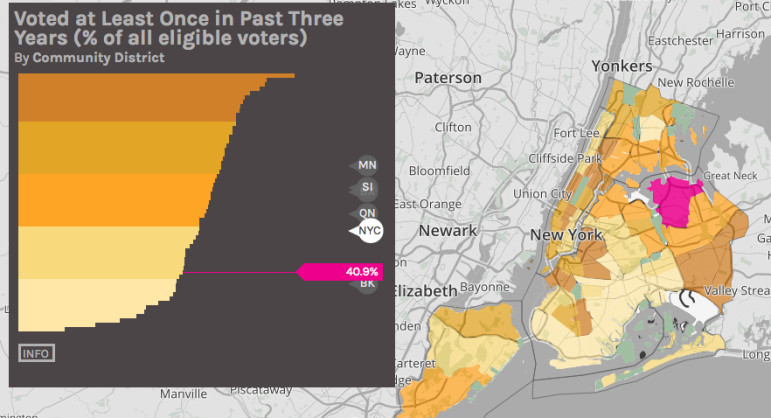
A chart generated by DATA2GO.NYC on political engagement.
This makes it possible to ask and answer questions like “Is there a connection between health insurance and life expectancy in New York City?” or “Which factors intersect to make the life of a child born in Brownsville different than that of a classmate born on the Upper West Side?” The tool is designed to draw new connections across sectors to delve deeper into New York City’s challenges, providing new insights for better, more effective policies and programs.
Take, for example, the ongoing foreclosure crisis among black and Latino households. To explore how foreclosures continue to affect New York City residents, we used DATA2GO.NYC to identify factors related to high foreclosure rates across community districts. In 2009, at the height of the housing bust, foreclosures swept through the city, spiking to an astonishing average of 24 foreclosures per 1,000 properties. The highest rate was in Bushwick, Brooklyn, which saw 61 foreclosed one-to-four family homes per 1,000 properties. The average has since declined to 17 foreclosures per 1,000 properties in 2014. This positive trend, however, masks a highly uneven recovery.
The problem remains stubbornly prevalent in districts with large black and Latino populations. The community districts with the top five foreclosure rates in 2014 are all areas where more than four in five residents are black or Latino. These were Bronx CD 4 (Mt. Eden, Highbridge, West Concourse, East Concourse, and Concourse Village), Brooklyn CD 16 (Ocean Hill and Brownsville), Bronx CD 5 (West Tremont area, South Fordham, University Heights, Morris Heights, and Mount Hope), Brooklyn CD 5 (parts of Broadway Junction, City Line, Cypress Hills, East New York, Highland Park, New Lots, Spring Creek, Starrett City) and Queens CD 12 (Hollis, parts of Jamaica, Jamaica Center, North Springfield Gardens, Rochdale, South Jamaica, St. Albans).
The higher the share of blacks and Latinos in a community district, the higher the foreclosure rate was in 2014. Even after holding median household income constant, the shares of black and Latino populations in a community district still had a significant relationship with foreclosure rates. What is most surprising is that despite the overall recovery, many neighborhoods with high concentrations of black and Latino residents have higher foreclosure rates today than in 2009, at the height of the housing bust and foreclosure crisis.
Owning property in New York City is a dream that many residents never realize. Losing a home after investing so much capital can set families back generations, particularly for black and Latino families who invest larger proportions of their overall wealth in primary homes. The mortgage crisis is clearly not over for them. To avoid the destabilizing impact of foreclosure, greater enforcement is needed in the mortgage servicing industry to protect families of color from predatory lenders. Further reforms should focus on incentives for inclusive lending and reductions in racial and ethnic discrimination in the mortgage market. Reducing rates of foreclosure could allow families to protect their chief assets, build wealth, and promote neighborhood stability, all of which also save the city money in the long run.
We created DATA2GO.NYC to catalyze improvements in policy-making and philanthropy and boost well-being across the five boroughs. How will you use it?
Sarah Burd-Sharps and Kristen Lewis are co-directors of Measure of America—a nonprofit, nonpartisan research and advocacy initiative of the Social Science Research Council—which created DATA2GO.NYC with a grant from The Leona M. and Harry B. Helmsley Charitable Trust. Measure of America statistician Andy Garon contributed to this article.