Well-Being in Rural California
WELL-BEING IN RURAL CALIFORNIA 2023
RELEASED JUNE 29, 2023
FULL REPORT | LAUNCH SLIDES | LAUNCH WEBINAR | DOWNLOAD DATA
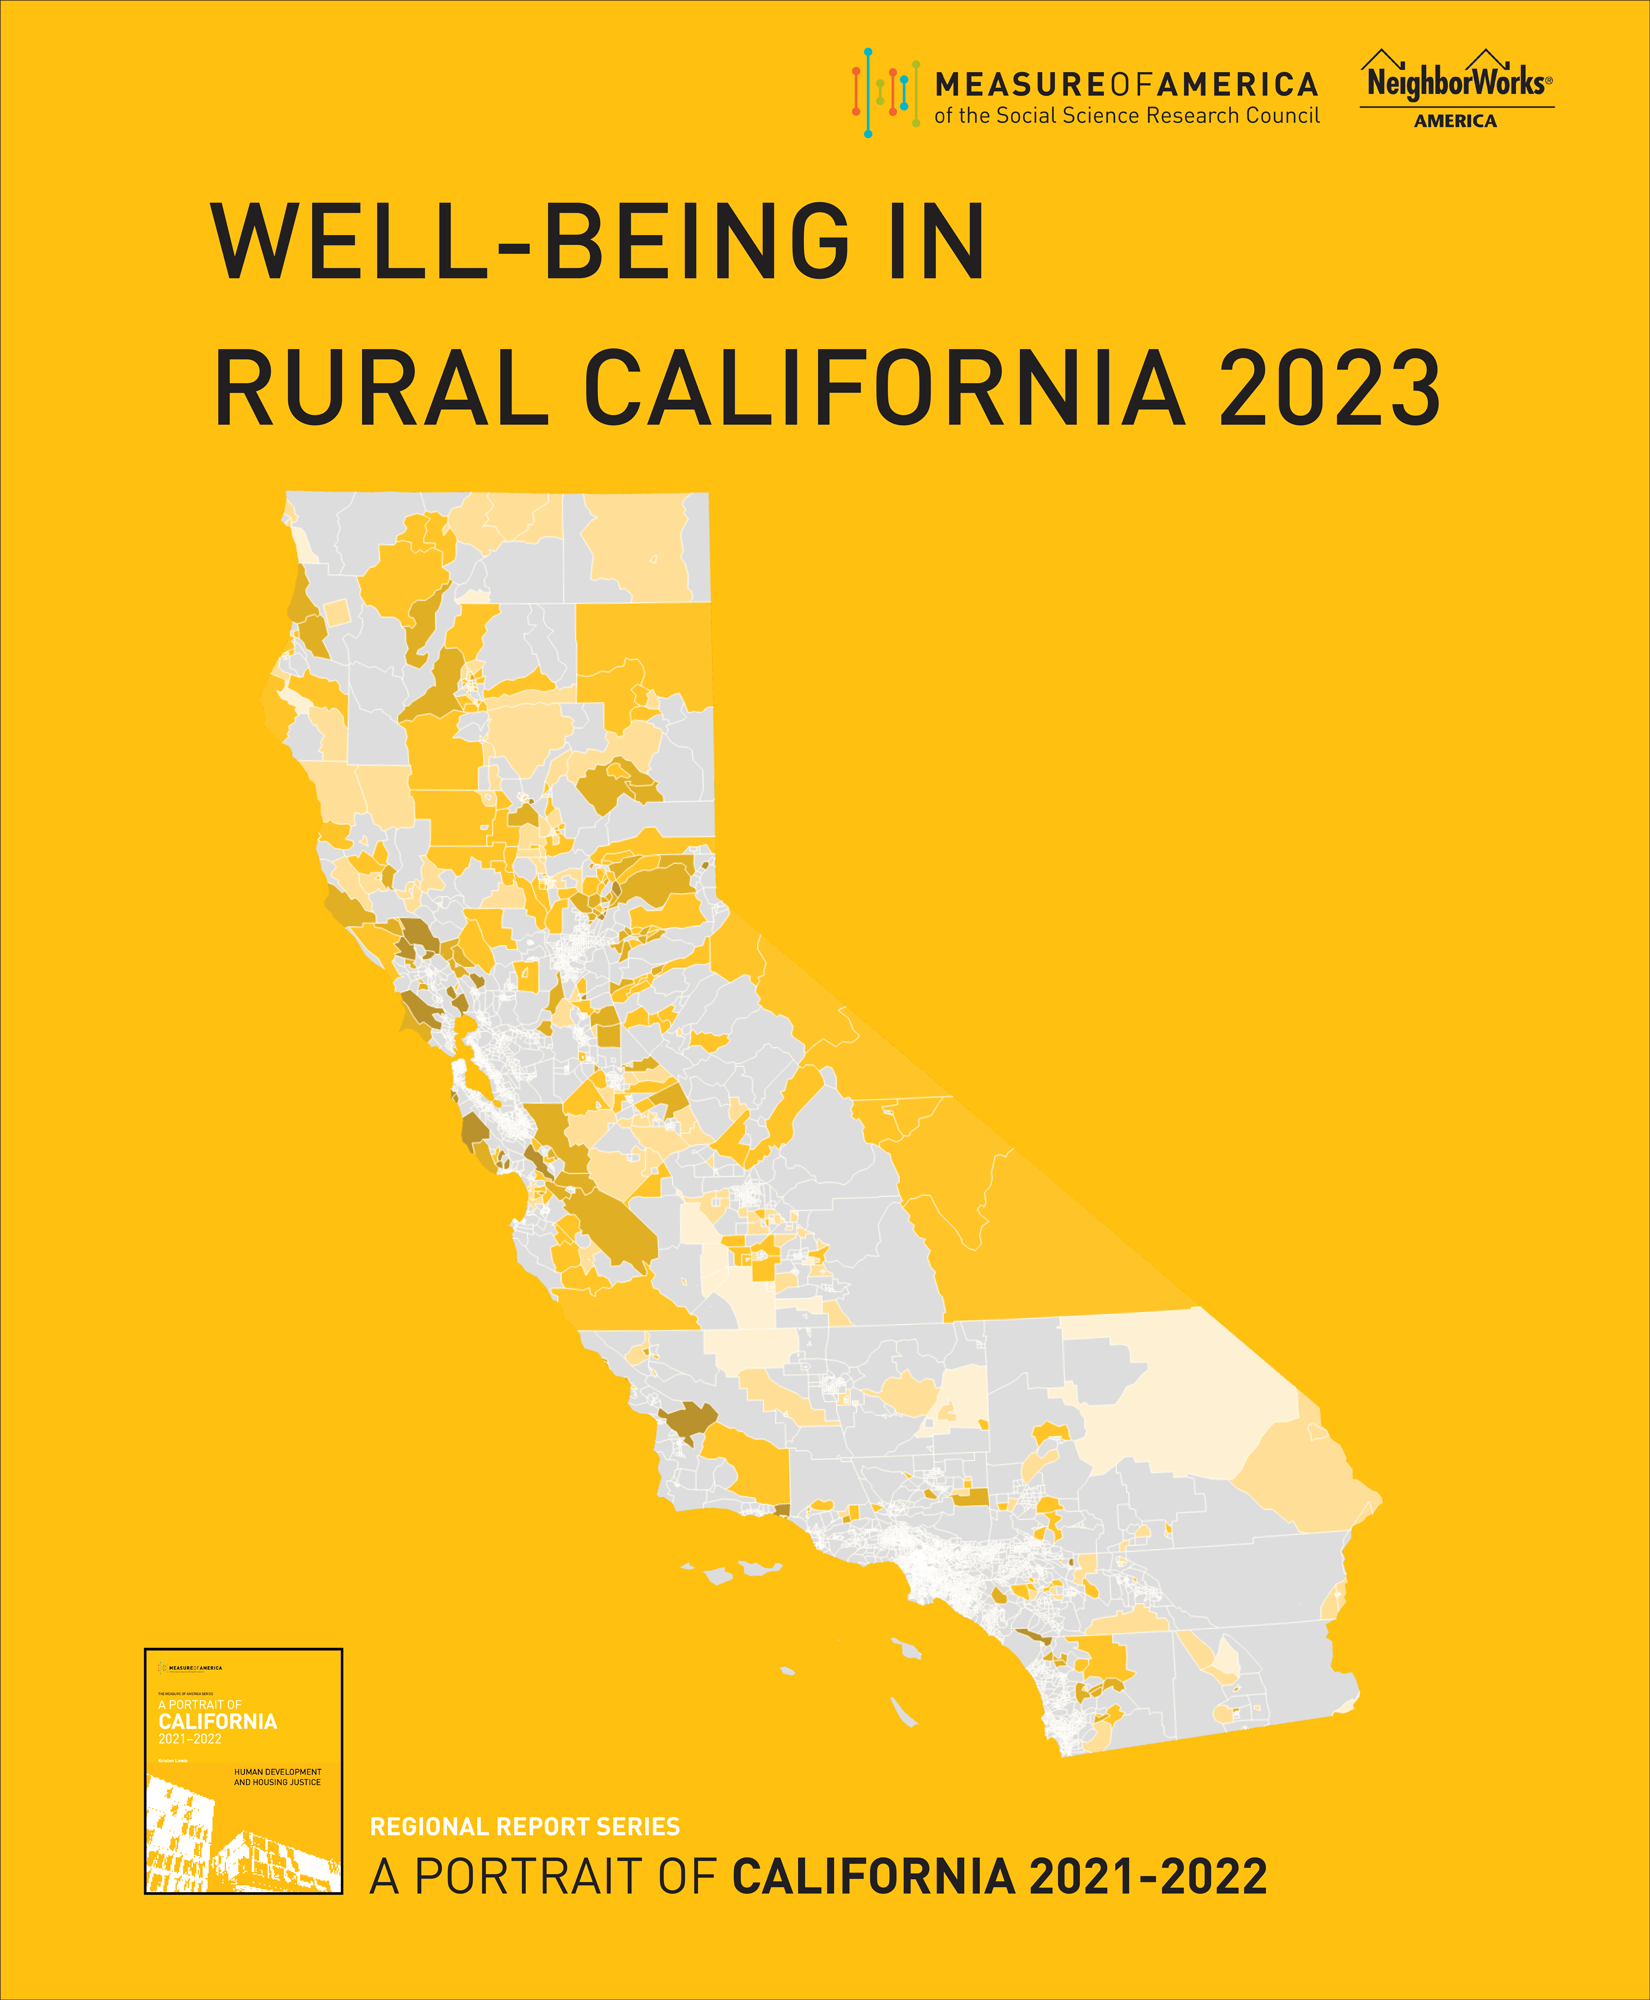 Well-Being in Rural California 2023 paints a picture of well-being and access to opportunity across race, place, and gender in rural California today. Using the American Human Development Index (HDI), this report presents how residents in rural California are doing on three key dimensions of well-being—a long and healthy life, access to knowledge, and a decent standard of living. Broken down by race and ethnicity, by gender, and by census tract, the index shows how communities are faring relative to one another and to the state and country as a whole. The report found that stark variation exists by place and by demographic group—resulting in significant inequalities across rural areas.
Well-Being in Rural California is part of a larger project, A Portrait of California 2021–2022, which explores well-being in the state as a whole, with a special focus on housing.
The HDI is expressed on a scale from zero to ten, with ten indicating higher levels of well-being across health, education, and standard of living. Rural California as a whole scores 4.84, falling significantly below the California statewide score of 5.85. Of the two racial and ethnic groups for whom it is possible to calculate HDI scores, white residents score 5.45 and Latino residents score 3.89.
Among census tracts in rural California, HDI scores range from a low of 1.79 in Census Tract 83.01 in Fresno County to a high of 8.47 in Census Tract 6136 in San Mateo County. Most higher-scoring rural tracts can be found in the mid-coast to northern region of the state; they tend to be predominantly white and affluent. The lower-scoring tracts are predominantly inland; seven of the lowest-scoring tracts lie in the Central Valley and three lie in California’s far north.
SELECT FINDINGS:
HEALTH:
- The average life expectancy in rural California is 79.8 years, compared to 81.1 years in the state as a whole. A baby girl born today in rural California can expect to live 82.3 years, a baby boy, 77.5 years—a 4.8-year difference.
EDUCATION:
- A slightly higher share of rural adults ages 25 and older have not completed high school (17.4 percent) compared to state residents overall (15.8 percent). Similarly, two and a half percentage points separate rural California from the state in terms of school enrollment—76.0 percent versus 78.5 percent.
- The difference is much greater when it comes to postsecondary degree attainment: compared to state residents overall, significantly smaller shares of rural Californians have bachelor’s degrees (22.9 percent versus 35.2 percent) or graduate degrees (7.8 percent versus 13.3 percent).
LIVING STANDARDS:
- Median personal earnings in rural California are $33,900, about $8,000 less than in the state overall. Men outearn women by a large margin, $40,100 versus $28,000, a difference of $12,100. Though the sizes of the earnings gaps vary by race and ethnicity, women across rural California earn much less than men, a phenomenon also found in California and in the country as a whole.
Spotlight on Del Norte County
SPOLIGHT ON DEL NORTE COUNTY
RELEASED JANUARY 16, 2023
FULL REPORT | LAUNCH SLIDES | LAUNCH WEBINAR | DOWNLOAD DATA
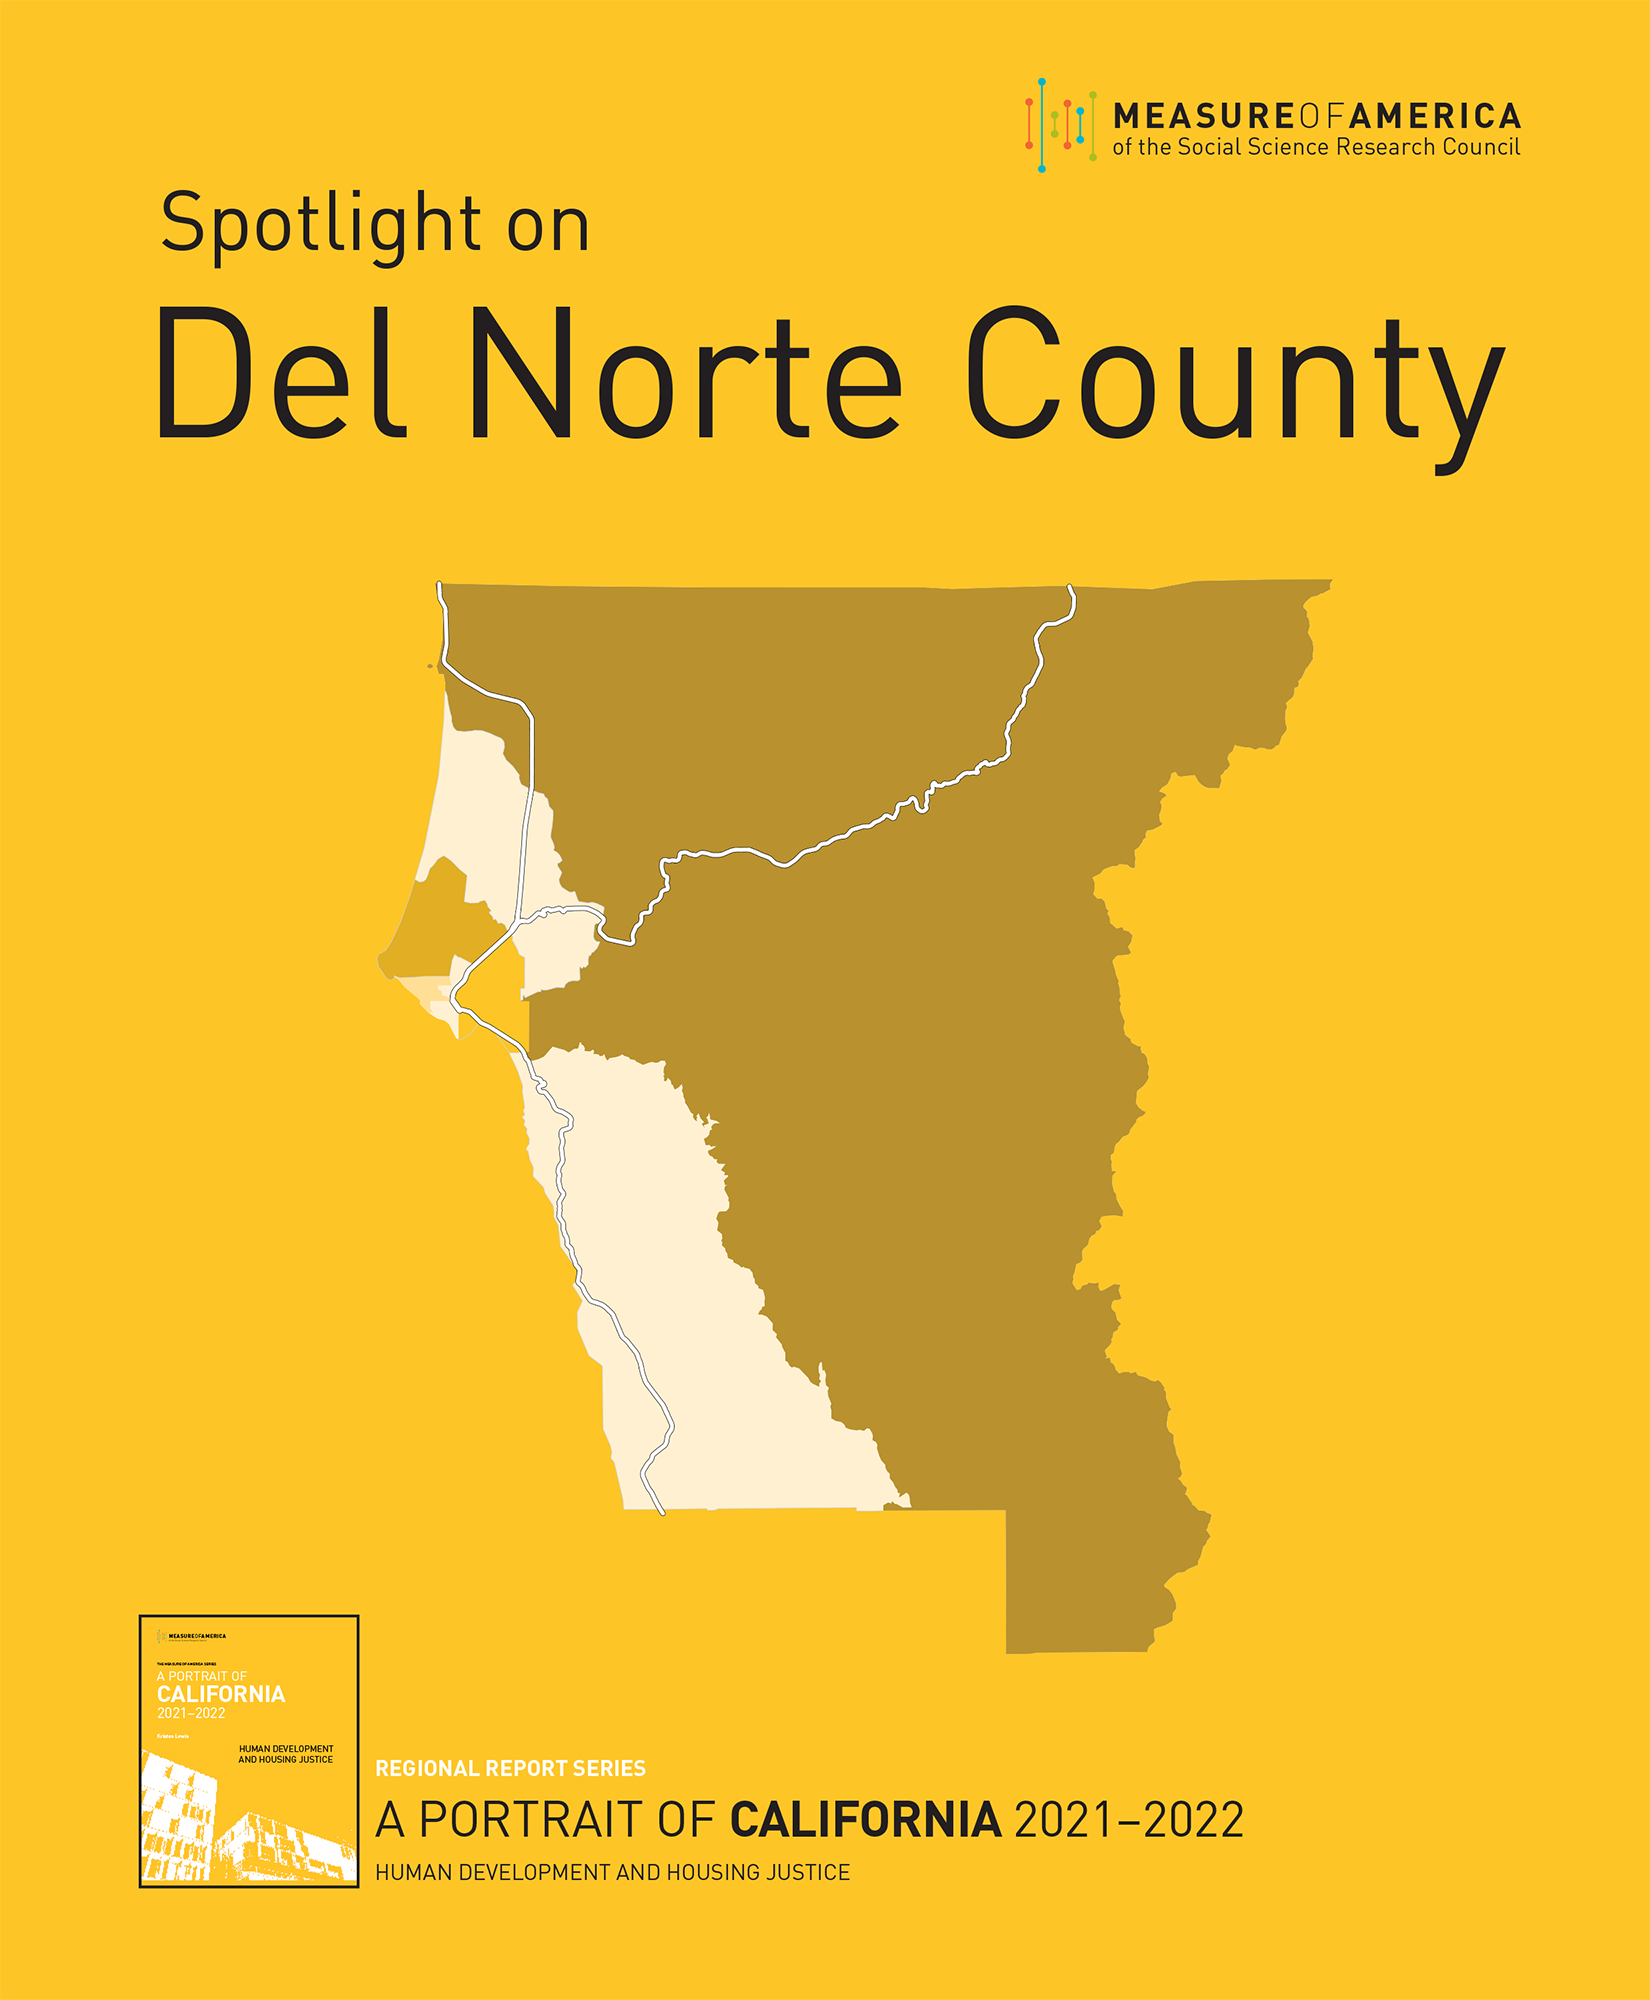 This Spotlight on Del Norte County, part of the Regional Report Series associated with A Portrait of California 2021–2022, paints a picture of well-being and access to opportunity across Del Norte County today. The Spotlight is an extensive study of well-being across race, place, and gender in this county. Using the American Human Development Index (HDI), this report presents how Del Norte County residents are doing on three key dimensions of well-being—a long and healthy life, access to knowledge, and a decent standard of living. Broken down by race and ethnicity, by gender, and by census tract, the index shows how communities across Del Norte County are faring relative to one another and to the state and country as a whole. The report found that stark variation exists by place and by demographic group—resulting in significant inequalities regionwide.
The HDI is expressed on a scale from zero to ten, with ten indicating higher levels of well-being across health, education, and standard of living. Del Norte County as a whole scores 4.17, falling significantly below the California statewide score of 5.85. Of the three racial and ethnic groups for whom it is possible to calculate an HDI score, white (4.90 out of 10) Del Norte residents have the highest levels of well-being, followed closely by Latino (4.60), with Native American (2.38) residents scoring considerably lower. Due to the small population sizes of the Asian, Native Hawaiian and other Pacific Islander, and Black populations in Del Norte, HDI score calculations are not possible for these groups.
The range of HDI scores by census tract in Del Norte County runs from a high of 5.38 in Census Tract 2.02, which includes much of the western parts of Del Norte County and towns such as French Hill, Idlewild, and Douglas Park, to a low of 2.56 in Census Tract 1.01, comprising mostly southern Crescent City.
SELECT FINDINGS:
HEALTH:
- The average life expectancy for residents of Del Norte County is 78.3 years, 2.7 years shorter than the state average. A baby girl born today in Del Norte can expect to live 80.8 years, nearly 5 years longer than a baby boy (76.1 years).
EDUCATION:
- Compared to the populations of California and the United States as a whole, adult residents of Del Norte are less likely to have earned high school diplomas and about half as likely to have earned bachelor’s degrees. While 79.7 percent of adults have at least a high school diploma, only 15.4 percent hold at least a bachelor’s degree and 5.9 percent hold a graduate degree
- Compared to boys and young men, girls and young women ages 3 to 24 have notably higher rates of enrollment in Del Norte (76.2 percent of females ages 3 to 24 are enrolled compared to 69.6 percent of males), and women enjoy an edge across all educational outcomes
LIVING STANDARDS:
- Median personal earnings in Del Norte are $30,200, about $9,700 less than in the state overall. Native American women have the lowest earnings of any race/gender combination in Del Norte County, $17,300. White men in Del Norte make more than double what Latina women earn: roughly $19,800 more. The gender gap between white men and white women comes out to $6,600 in annual earnings; the earnings gender gap between Latino men and women is $7,100 annually
Spotlight on Mendocino County
SPOLIGHT ON MENDOCINO COUNTY
RELEASED JANUARY 16, 2023
FULL REPORT | LAUNCH SLIDES | LAUNCH WEBINAR | DOWNLOAD DATA
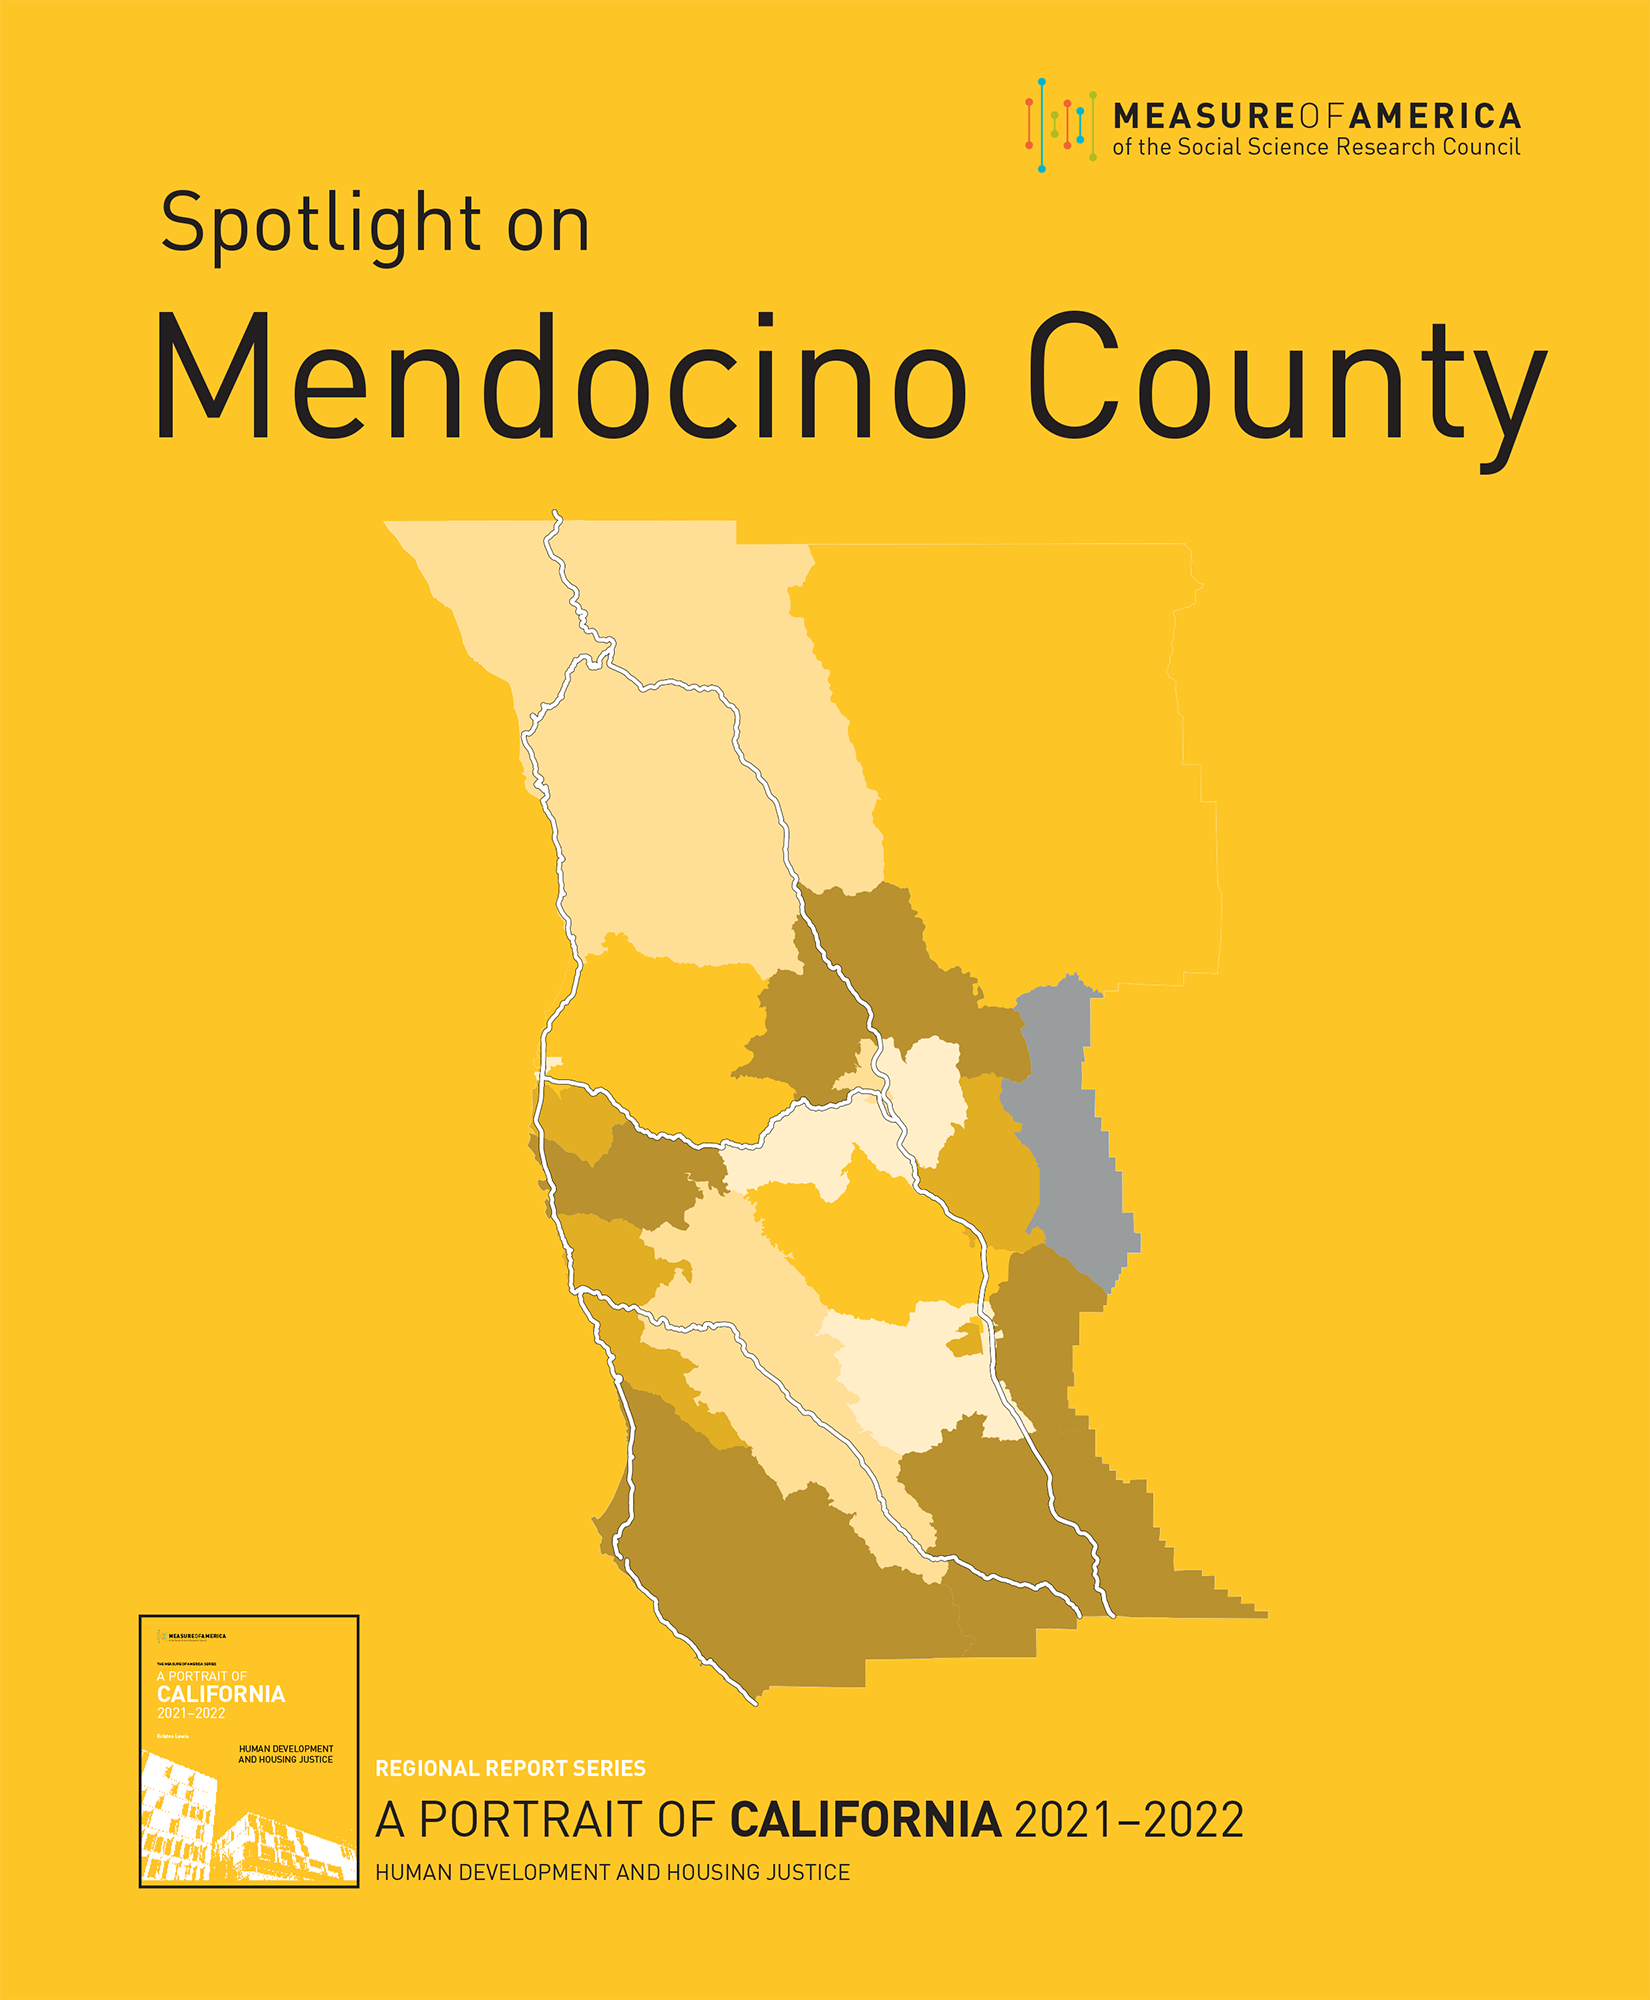 This Spotlight on Mendocino County, part of the Regional Report Series associated with A Portrait of California 2021–2022, paints a picture of well-being and access to opportunity across Mendocino County today. The Spotlight is an extensive study of well-being across race, place, and gender in this county. Using the American Human Development Index (HDI), this report presents how Mendocino County residents are doing on three key dimensions of well-being—a long and healthy life, access to knowledge, and a decent standard of living. Broken down by race and ethnicity, by gender, and by census tract, the index shows how communities across Mendocino County are faring relative to one another and to the state and country as a whole. The report found that stark variation exists by place and by demographic group—resulting in significant inequalities regionwide.
The HDI is expressed on a scale from zero to ten, with ten indicating higher levels of well-being across health, education, and standard of living. Mendocino County as a whole scores 4.53, falling significantly below the California statewide score of 5.85. Of the four racial and ethnic groups for whom it is possible to calculate an HDI score, Asian (5.71 out of 10) Mendocino residents have the highest levels of well-being, followed by white (5.37), Latino (4.71), and Native American (3.58) residents. The Black population in Mendocino County is about 600 people, which is too small to calculate a reliable HDI score. In California as a whole, the Black score is 4.44.
The range of HDI scores by census tract in Mendocino County runs from a high of 6.74 in Census Tract 117, which includes areas east of Ukiah including Regina Heights, Talmage, Vichy Springs, and the Guidiville Rancheria, to a low of 3.16 in Census Tract 115.02, which includes the northeastern section of Ukiah and Orrs Creek as well as Oak Manor.
SELECT FINDINGS:
HEALTH:
- The average life expectancy for residents of Mendocino County is 78.8 years, 2.3 years shorter than the state average. A baby girl born today in Mendocino can expect to live 82.4 years, 6.9 years longer than a baby boy (75.5 years).
EDUCATION:
- Compared to California as a whole, adult residents of Mendocino are slightly more likely to have graduated from high school and less likely to have earned bachelor’s degrees. While 86.7 percent of adults have at least a high school diploma, 24.0 percent hold at least a bachelor’s degree and 9.2 percent hold a graduate degree.
- Compared to boys and young men, girls and young women ages 3 to 24 have notably higher rates of enrollment in Mendocino (79.1 percent of females ages 3 to 24 are enrolled compared to 75.4 percent of males) and enjoy an edge across all educational outcomes—though this educational advantage is not reflected in their earnings.
LIVING STANDARDS:
- Median personal earnings in Mendocino are $28,500, about $11,400 less than in the state overall. The gender gap in earnings is persistent across the United States and California. For the state as a whole, women earn 73 cents for every dollar men earn. That pattern holds in Mendocino, where women earn 71 cents for every dollar men earn. This translates into a gap of $9,300 in annual earnings, as men earn $32,800 compared to $23,500 for women.
A Portrait of the Valley
A PORTRAIT OF THE VALLEY: SAN JOAQUIN VALLEY HUMAN DEVELOPMENT REPORT 2023
RELEASED MAR 9, 2023
FULL REPORT | PRESS RELEASE | DOWNLOAD DATA
 A Portrait of the Valley: San Joaquin Valley Human Development Report 2023, paints a picture of well-being and access to opportunity across the San Joaquin Valley today. The Portrait is an extensive study of well-being across race, place, and gender in the eight-county San Joaquin Valley region. Using the American Human Development Index (HDI), this report presents how Valley residents are doing on three key dimensions of well-being—a long and healthy life, access to knowledge, and a decent standard of living. Broken down by race and ethnicity, by gender, and by census tract, the index shows how communities across the San Joaquin Valley are faring relative to one another and to the state and country as a whole. The report found that stark variation exists by place and by demographic group—resulting in significant inequalities regionwide.
A Portrait of the Valley is part of a larger project, A Portrait of California 2021–2022, which explores well-being in the state as a whole, with a special focus on housing.
The HDI is expressed on a scale from zero to ten, with ten indicating higher levels of well-being across health, education, and standard of living. The San Joaquin Valley as a whole scores 4.31, falling significantly below the California statewide score of 5.85. Of the six racial and ethnic groups for whom it is possible to calculate an HDI score, Asian (5.55 out of 10) and white (5.18) Valley residents have the highest levels of well-being. Residents who identify as Native Hawaiian and other Pacific Islander (4.17), Latino (3.87), Black (3.32), and Native American (2.67) have much lower scores, indicating the greater challenges to well-being and access to opportunity these groups face.
Among census tracts in the San Joaquin Valley, HDI scores range from a low of 0.96 in Census Tract 13.01 in Kern County to a high of 8.58 in Census Tract 43.01 in Fresno County. Over 200 census tracts in the Valley—more than one in five—score below 3.0 on the 10-point HDI scale. Residents of these areas face more barriers to opportunity than do those who live in the San Joaquin Valley’s higher-scoring areas. They have much lower levels of well-being—shorter life expectancies, less access to education, and extremely low earnings—than others in the region or the state, on average. The residents of these census tracts tended to be most vulnerable when the Covid-19 pandemic hit and continue to face the greatest challenges to recovery today.
SELECT FINDINGS:
HEALTH:
- The average life expectancy for residents of the San Joaquin Valley is 78.2 years, 2.9 years shorter than the state average. A baby girl born today in the San Joaquin Valley can expect to live 81.0 years, a baby boy, 75.6 years—a 5.4-year difference.
EDUCATION:
- Compared to adults ages 25 and up in California as a whole, adult residents of the San Joaquin Valley are less likely to have earned a high school diploma, 84.5 percent compared to 76.1 percent, and about half as likely to hold a bachelor’s degree, 37.1 percent compared to 18.0 percent.
- San Joaquin Valley young people between the ages of 3 and 24 are about as likely to be enrolled in school as other young Californians, however. Compared to boys and young men, girls and young women ages 3 to 24 have slightly higher rates of school enrollment in the San Joaquin Valley, and women ages 25 and up enjoy an edge over their male counterparts across all educational outcomes, from high school graduation to graduate degree attainment—though this educational advantage is not reflected in their earnings.
LIVING STANDARDS:
- Median personal earnings in the San Joaquin Valley are $31,100, about $8,800 less than in the state overall. Men vastly outearn women, $35,900 versus $25,500, a difference of $10,400. Though the sizes of the earnings gaps vary by race and ethnicity, women across the San Joaquin Valley earn much less than men, a phenomenon also found in California and in the country as a whole.
Spotlight on Del Norte County & Spotlight on Mendocino County
SPOTLIGHT ON DEL NORTE COUNTY & SPOTLIGHT ON MENDOCINO COUNTY
RELEASED JANUARY 16, 2023
 |
 |
Spotlight on Del Norte County and Spotlight on Mendocino County paint a picture of well-being and access to opportunity in Mendocino and Del Norte Counties today. The creation of the Spotlights was guided by an public servants, advocates, scholars, and nonprofit leaders from Del Norte and Mendocino Counties. These Spotlights are all part of a larger project, which explores well-being in the state as a whole, with a special focus on housing: A Portrait of California 2021–2022.
Using the American Human Development Index (HDI), these two Spotlights present how Mendocino County and Del Norte County residents are doing on three key dimensions of well-being—a long and healthy life, access to knowledge, and a decent standard of living. Broken down by race and ethnicity, by gender, and by census tract, the HDI shows how communities across Del Norte County and Mendocino County are faring relative to one another and to the state and country as a whole.
For media and all other inquiries, contact us at: contact@measureofamerica.org
A Portrait of California 2021–2022
LAUNCHED NOVEMBER 10, 2021
FULL REPORT | MEDIA RELEASE | INTERACTIVE MAP
Regional Report Series: Inland Empire | Sonoma County | San Joaquin Valley | Del Norte County | Mendocino County | Rural California
 A Portrait of California 2021–2022: Human Development and Housing Justice, the third volume in Measure of America’s Portrait of California series, takes a human development approach to understanding the country’s most populous and diverse state. Using the American Human Development Index (HDI), it presents a detailed picture of how Californians are doing on three key dimensions of well-being—a long and healthy life, access to knowledge, and a decent standard of living. In addition to an in-depth survey of well-being levels across the state, this volume in the Portrait of California series focuses on a central prerequisite to a good life, one that far too many Californians struggle to attain: access to safe and secure housing. The Covid-19 pandemic dramatically underscored the importance of stable, affordable housing when it comes to access to education, living standards, and health. A Portrait of California 2021–2022: Human Development and Housing Justice explores the impact of California’s housing crisis on all three components of the index and outlines policies that can help the state address homelessness and housing insecurity to ensure that all Californians have a safe place to call home.
This report presents HDI scores for the state overall as well as by gender, by race and ethnicity, by nativity, by metro area, and by neighborhood cluster. In addition to providing HDI scores for various groups and geographies, it also delves deeper into the underlying causes of the gaps in well-being between them—structural racism, discrimination, sky-high housing costs, among others—and offers recommendations for addressing these challenges and building a fairer future for the Golden State, one in which every Californian can lead a freely chosen life of value.
KEY FINDINGS
AMERICAN HUMAN DEVELOPMENT INDEX
- California scores 5.85 out of 10 on the American Human Development Index, with gains in all three components of the HDI since 2009. California’s HDI score is higher than the country’s as a whole and has improved at a faster rate.
- Looking at scores by race and ethnicity, however, reveals that of the state’s six major racial and ethnic groups, only two—Latino and Asian Californians—have seen improvement in overall well-being. Latino Californians experienced the greatest increase on the HDI of any racial or ethnic group, from 3.99 in Portrait of California 2011 to 4.81 now. The scores for white, Black, and Native American Californians declined between 2009 and 2019. Since 2000, the HDI score for Native American Californians has declined by an alarming 22.5 percent, the sharpest drop experienced by any group. This is the first year for which we have an HDI score for Native Hawaiian and Other Pacific Islander (NHOPI) Californians, 4.20.
- Overall, women in California score slightly higher than men, 5.81 compared to 5.73, faring better on the health and education components of the index. Black, Latina, Native American, and NHOPI women all score higher than their male counterparts, while white and Asian women score lower due to the especially large gender earnings gaps within these groups.
- Greater San Jose scores the highest on the HDI of California’s metro areas, 8.09, while Madera scores the lowest. Greater Los Angeles contains the widest well-being range in the state.

FIVE CALIFORNIAS
While comparing the highest- and lowest-scoring areas is useful for understanding California’s human development extremes, most places fall somewhere along the vast well-being continuum present in the state. In order to make sense of California’s 265 neighborhood clusters and to highlight commonalities shared by different places, this report sorts areas with similar HDI scores into five groups:
- One Percent California comprises six neighborhood clusters with scores of 9.00 or higher on the HDI, five of which are located in the Bay Area. The 900,000, people, 2.3 percent of the state population, living in these communities enjoy higher levels of well-being and greater access to opportunity than almost anyone in the country.
- Elite Enclave California is home to roughly eight million people, or one-fifth of the state’s population. Its fifty-six neighborhood clusters, scoring between 7.00 and 8.99 on the index, are found almost entirely in the Bay Area, Los Angeles, and San Diego.
- Main Street California neighborhood clusters score between 5.00 and 6.99 on the HDI. More than eighteen million people, 46 percent of the population, live in one of these 121 areas. Main Street Californians have higher levels of wellbeing than the average US resident. Nonetheless, California’s high cost of living means that some Main Streeters face levels of economic insecurity similar to that of Struggling California.
- Struggling California is made up of eighty-two neighborhood clusters with index scores between 3.00 and 4.99, found chiefly in greater Los Angeles, the Inland Empire, the Central Valley, greater San Diego, and northern California. Its residents, who make up roughly 30 percent of the state’s population, have lower levels of well-being than the typical American.
- Disenfranchised California comprises areas that score below 3.00 on the HDI. Today, none of the state’s 265 neighborhood and town clusters meet this criteria, compared to nine in A Portrait of California 2014–2015 and eleven in the 2011 volume.
A LONG AND HEALTHY LIFE
- The health component of the index is measured by life expectancy at birth. A baby born in California today can expect to live 81.0 years on average, compared to 78.8 years in the US overall. Since 2012, life expectancy in California—and in the country as a whole—has dropped by 0.2 years.
- Of the state’s major racial and ethnic groups, Native American Californians have the shortest life expectancy, 71.2 years, and have experienced the greatest loss in life expectancy since 2012, a decrease of over 8 years. Asian Californians live the longest, on average, 87.0 years, although life expectancies vary significantly among Asian subgroups. Black Californians’ life expectancy (74.1 years) decreased by a concerning 1.5 years between 2012 and 2019, and has no doubt fallen further due to the pandemic.
- Over 12 years separate the life expectancies of the longest- and shortest-living neighborhood clusters, Milpitas & Northeast San Jose (87.3 years) and West San Bernardino (75.0 years). The neighborhood clusters with the longest average life expectancies have a relatively higher proportion of Asian residents, while neighborhoods at the bottom of the list tend to have a relatively higher proportion of Black or Latino residents, highlighting the negative impact of residential segregation on health outcomes.
 ACCESS TO EDUCATION
- California is ahead of the United States overall on the education dimension of the index, measured by a combination of degree attainment and school enrollment indicators. Compared to the US as a whole, California has slightly higher bachelor’s and graduate degree attainment rates, but the share of adults age 25 and older without a high school degree in California, 15.9 percent, is higher than the national rate, 11.4 percent.
- While California fares better overall on the education component of the index than the country as a whole, gaps between racial and ethnic groups persist. Even where the Latino Education Index score is the highest—the rural Humboldt County area—Latinos score more than one point below the average Californian and well below the local white population.
- Education and income are closely linked in California. The highest-educated neighborhood clusters are concentrated in the affluent neighborhoods and suburbs of three major metropolitan areas, the Bay Area, Los Angeles, and San Diego. Conversely, the neighborhoods with the lowest Education Index scores—concentrated in urban city centers in Los Angeles as well as in both urban and rural communities in the Central Valley and the Inland Empire—are among the lowest-earning in the state.
- California’s youth disconnection rate—the share of teens and young adults who are neither working nor in school—is 10.3 percent and declined each year for the past decade. Unfortunately, we anticipate that data from 2020 and 2021 will show pandemic-induced spikes in the youth disconnection rate. Wide disparities between different geographies and groups persist: Asian and white young people have the lowest disconnection rates, 6.0 percent and 8.9 percent, respectively, while Black and Native American youth have the highest, 18.4 percent and 23.2 percent.

 A DECENT STANDARD OF LIVING
- The standard of living dimension of the index is measured by median personal earnings. In California, the typical worker takes home $39,500 annually, $3,000 more than the US median. White workers earn the most ($51,700), followed by Asian workers ($51,100), NHOPI workers ($38,200), Black workers ($36,400), Native American workers ($32,400), and Latino workers ($30,200).
- Earnings gaps are even more striking when gender is taken into account: at the high end of the earnings scale, white men take home $61,600 each year, while Latina women, the lowest-paid group in the state, earn just $25,100. Although the size of the gaps varies, women earn less than men in each major racial and ethnic group, and the Covid-19 pandemic threatens to set women—especially women of color—even further back.

- In each of California’s metro areas, white workers earn more than the state median, while Latino workers earn less. The Latino-white pay gap is widest in San Jose, where Latinos earn $0.46 for every dollar earned by white workers.
- A difference of nearly $100,000 separates California’s highest- and lowest-earning neighborhood clusters: earnings range from $22,100 in Los Angeles’ East Vernon neighborhood to $120,400 in Cupertino, Saratoga & Los Gatos in Santa Clara County.
Press Conference: Groundbreaking Investments in California’s Central Valley to Unleash Latino Civic and Economic Power to be Announced
July 18, 2019 — Business Wire
Opportunity Summit 2019
May 30, 2019 — The San Diego Voice & Viewpoint
The Latino Community Foundation to Host 2019 Latino Policy Summit Calling on the Latino Community in California to Make Their Voices Heard in 2020
April 23, 2019 — BusinessWire
Don’t believe the naysayers. California isn’t too big, too depopulated or too ungovernable
August 16, 2018 — Los Angeles Times